


APS agencies
Australian Public Service agencies are grouped into functional clusters to show agencies with similar primary functions. The functional clusters applied to APS agencies are:
- Policy ꟷ agencies involved in the development of public policy.
- Smaller operational ꟷ agencies with fewer than 1,000 employees involved in the implementation of public policy.
- Larger operational ꟷ agencies with 1,000 employees or more involved in the implementation of public policy.
- Regulatory ꟷ agencies involved in regulation and inspection.
- Specialist ꟷ agencies providing specialist support to Government.
- National cultural institution ꟷ agencies that maintain collections of material and offer public programs relevant to Australia’s cultural heritage.
Figure 3 shows the representation of functional clusters within the APS at 30 June 2025.
Figure 3: Functional clusters as a proportion of APS headcount (at 30 June 2025)
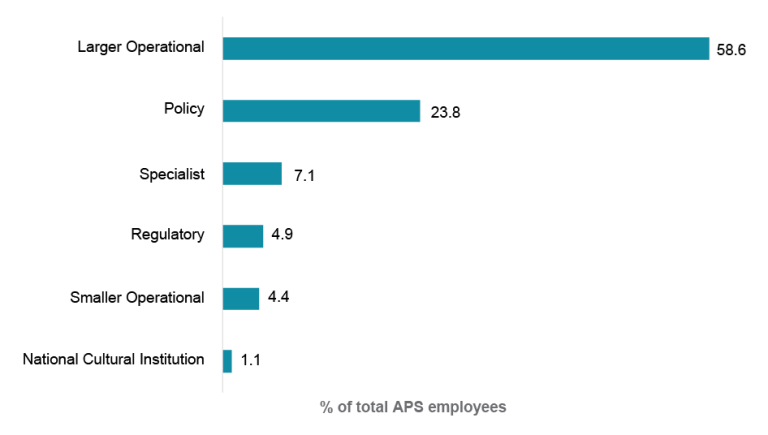
Source: APSED
Figure 4 shows the representation of portfolio proportion in the APS at 30 June 2025.
Figure 4: Portfolios as a proportion of APS headcount (at 30 June 2025)

Source: APSED
Tables 14 and 15 show the agencies with the largest increases and reductions in number of employees from 30 June 2024 to 30 June 2025.
Table 14: Agencies with the largest annual increases in employee headcount (at 30 June 2025)
| Agency | Ongoing | Non-ongoing | Net increase | |||
|---|---|---|---|---|---|---|
| Headcount | % | Headcount | % | Headcount | % | |
| National Disability Insurance Agency | +2,592 | +34.4% | +164 | +53.9% | +2,756 | +35.1% |
| Services Australia | +2,033 | +6.2% | -382 | -46.6% | +1,651 | +4.9% |
| Australian Electoral Commission | +282 | +31.3% | +1,218 | +57.7% | +1,500 | +49.8% |
| Agriculture, Fisheries and Forestry | +1,146 | +21.3% | -28 | -6.0% | +1,118 | +19.1% |
| Defence | +875 | +4.5% | -112 | -32.5% | +763 | +3.9% |
Source: APSED
Notes:
1. Figures represent the net change and the percentage change from 30 June 2024 to 30 June 2025.
2. Table excludes the whole agency Machinery of Government change for the Administrative Appeals Tribunal to Administrative Review Tribunal.
3. A Federal Election was held on 3 May 2025.
Table 15: Agencies with the largest annual reductions of employee headcount (at 30 June 2025)
| Agency | Ongoing | Non-ongoing | Net decrease | |||
|---|---|---|---|---|---|---|
| Headcount | % | Headcount | % | Headcount | % | |
| Australian Taxation Office | -259 | -1.3% | +144 | +8.8% | -115 | -0.5% |
| Bureau of Meteorology | +11 | +0.6% | -66 | -35.7% | -55 | -2.9% |
| Office of the Australian Information Commissioner | -47 | -23.9% | +6 | -25.0% | -41 | -18.6% |
| National Indigenous Australians Agency | +14 | +1.0% | -50 | -45.5% | -36 | -2.3% |
| Great Barrier Reef Marine Park Authority | -18 | -7.5% | -13 | -56.5% | -31 | -11.8% |
Source: APSED
Notes:
1. Figures represent the net change and percentage change from 30 June 2024 to 30 June 2025.
2. Australian Taxation Office numbers include 187 ongoing and 7 non-ongoing employees that moved to the Australian Securities and Investments Commission due to a Machinery of Government change.
See also in this report
Appendix 3 – List of APS agencies
Find out more
Australian Public Service Commission (2025) APS Agencies – size and function, APSC website, accessed 12 August 2025.