


APS at a glance
Figure 1: APS at a glance data (at 30 June 2025)

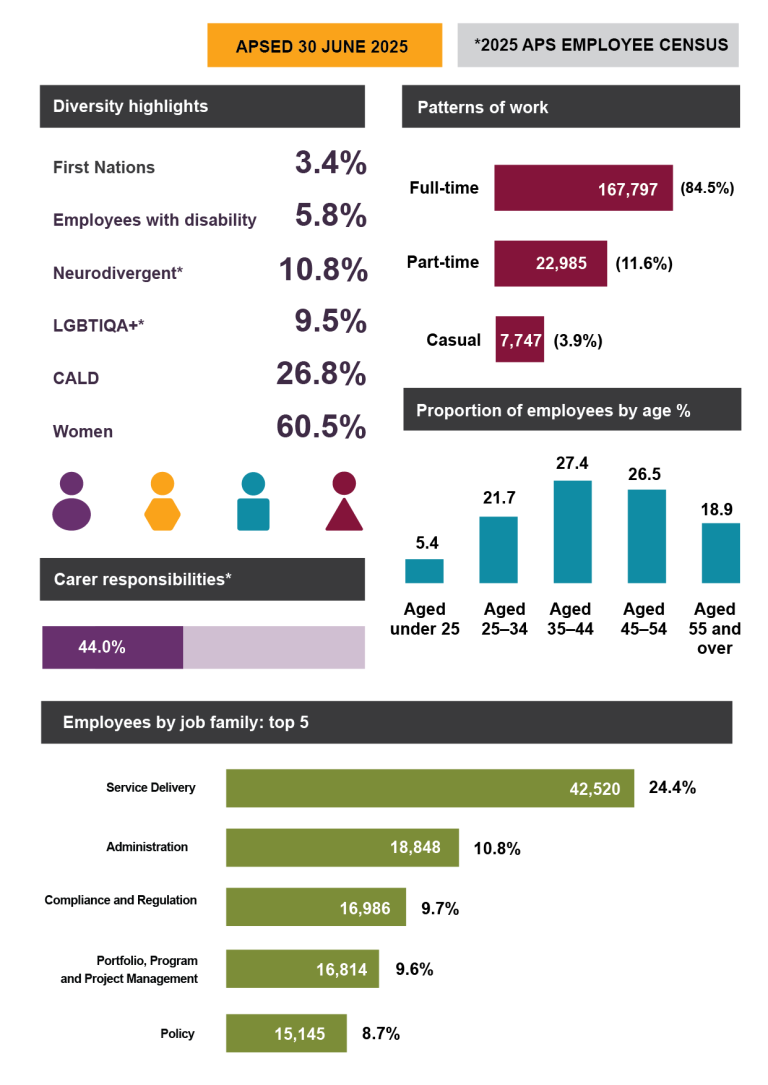
Sources: APSED and APS Employee Census
Table 1: APS employee headcount (at 30 June 2025)
| Employee type | Number of employees |
|---|---|
| Employee headcount | 198,529 |
| Number of ongoing employees | 184,442 |
| Number of non-ongoing employees | 14,087 |
Source: APSED
Table 2: Number of APS agencies (at 30 June 2025)
| APS agencies | Number of agencies |
|---|---|
| Total APS agencies | 102 |
Source: APSED
Table 3: Proportion of employees by classification (at 30 June 2025)
| Classification | Percentage (%) |
|---|---|
| Trainee | 0.3 |
| Graduate | 0.9 |
| APS 1 | 1.9 |
| APS 2 | 2.2 |
| APS 3 | 6.6 |
| APS 4 | 18.6 |
| APS 5 | 14.5 |
| APS 6 | 23.7 |
| EL 1 | 20.7 |
| EL 2 | 8.8 |
| SES Band 1 | 1.3 |
| SES Band 2 and 3 | 0.5 |
Source: APSED
Note: EL = Executive Level; SES = Senior Executive Service.
Table 4: Number and proportion of employees by location (at 30 June 2025)
| Location | Number | Percentage (%) |
|---|---|---|
| Australian Capital Territory | 70,221 | 35.4 |
| Victoria | 35,679 | 18.0 |
| New South Wales | 33,646 | 16.9 |
| Queensland | 26,448 | 13.3 |
| South Australia | 14,111 | 7.1 |
| Western Australia | 9,839 | 5.0 |
| Tasmania | 4,734 | 2.4 |
| Northern Territory | 2,255 | 1.1 |
| Capital cities | 172,015 | 86.6 |
| Regional | 24,918 | 12.6 |
| Overseas | 1,596 | 0.8 |
Source: APSED
Table 5: Diversity in the APS
| Diversity group | Number | Percentage (%) |
|---|---|---|
| First Nations employees (APSED, 30 June 2025) |
6,728 | 3.4 |
| Employees with disability (APSED, 30 June 2025) |
11,535 | 5.8 |
| Employees whose first language is not exclusively English (APSED, 30 June 2025) |
41,001 | 26.8 |
| Women (APSED, 30 June 2025) |
120,098 | 60.5 |
| Employees who consider themselves to be neurodivergent (2025 APS Employee Census) |
16,165 | 10.8 |
| Employees who identify as LGBTIQA+ (lesbian, gay, bisexual, transgender, intersex, queer, asexual and other sexually or gender diverse) (2025 APS Employee Census) |
14,277 | 9.5 |
Source: APSED and APS Employee Census
Table 6: Patterns of work of all APS employees (at 30 June 2025)
| Pattern of work | Number | Percentage (%) |
|---|---|---|
| Full-time | 167,797 | 84.5 |
| Part-time | 22,985 | 11.6 |
| Casual | 7,747 | 3.9 |
Source: APSED
Table 7: Proportion of APS employees by age group (at 30 June 2025)
| Age group | Number | Percentage (%) |
|---|---|---|
| Aged under 25 | 10,785 | 5.4 |
| Aged 25-34 | 43,106 | 21.7 |
| Aged 35-44 | 54,488 | 27.4 |
| Aged 45-54 | 52,697 | 26.5 |
| Aged 55 and over | 37,453 | 18.9 |
Source: APSED
Table 8: Proportion of APS employees with carer responsibilities
| Proportion of APS employees | Number | Percentage (%) |
|---|---|---|
| Employees with carer responsibilities | 66,103 | 44.0 |
Source: 2025 APS Employee Census
Table 9: Proportion of APS employees by job family: top 5 (at 30 June 2025)
| Top 5 job families | Number | Percentage (%) |
|---|---|---|
| Service Delivery | 45,520 | 24.4 |
| Administration | 18,848 | 10.8 |
| Compliance and Regulation | 16,986 | 9.7 |
| Portfolio, Program and Project Management | 16,814 | 9.6 |
| Policy | 15,145 | 8.7 |
Source: APSED