


Trust and satisfaction insights
Who trusts?

|
Life satisfaction75% of people who were satisfied with life[7] reported trust in public services [1], compared with 40% of people who were dissatisfied with life. |

|
Gender66% of men reported trust in public services compared to 59% of women. |

|
Regional and metro areasMore people who live in metro areas reported trust in public services (65%) |

|
Income69% of those earning above a weekly wage of $1,249 reported trust in public services compared to 59% of people earning less than $1,250 weekly. |

|
Language spoken at home74% of people who primarily speak a language other than English at home reported trust in Australian public services, compared to 62% who primarily speak English at home. |

|
Trust in people80% of people who trusted others[8] also reported trust in public services, compared with 42% for those who distrusted others. |

|
AgeTrust in public services was highest for people aged 18-34 (70%) and lower for people aged 35-64 (59%) and 65+ (60%). |

|
Education levels65% of those who graduated year 12 reported trust in public services compared to 48% of people who left education before year 12. |

|
Country of birth67% of people born in a country other than Australia reported trust in Australian public services compared with 61% of people born in Australia. |
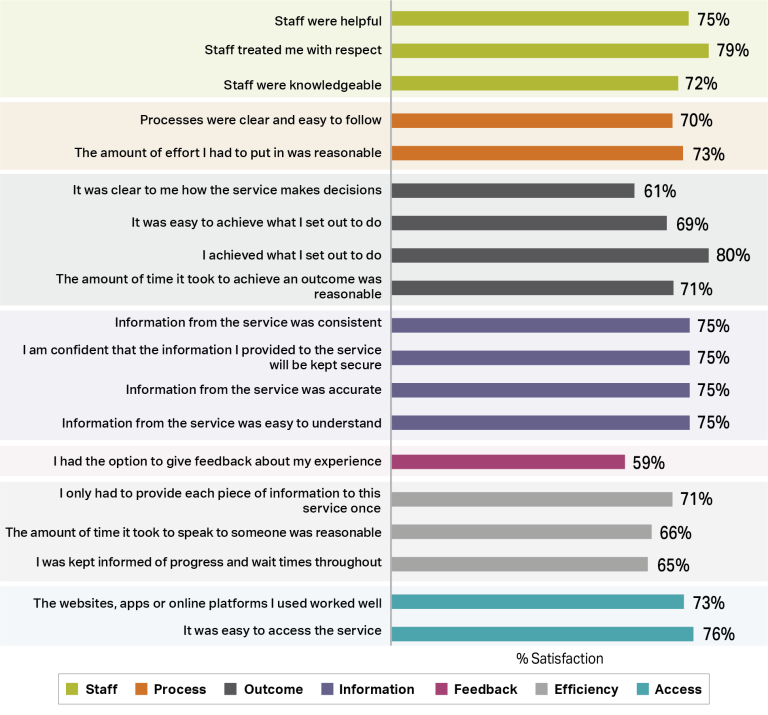
What aspects of services were people satisfied with?
In 2025, people were most satisfied[4] with:
- their respectful interactions with staff
- the ease with which they could access the service.
People were least satisfied[5] with elements of service processes, such as:
- being kept informed of progress and wait times
- clarity on how the service makes decisions
- availability of options to give feedback about their experience.
80% of people indicated that they achieved what they set out to do and 69% indicated it was easy to do so.
Figure 2: Proportion of people who were satisfied with elements of the service
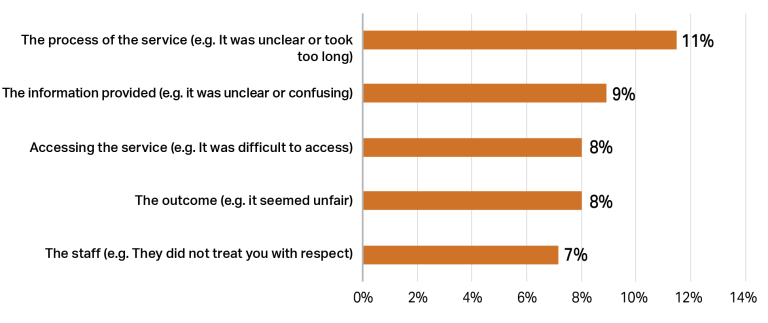
What aspects of services were people dissatisfied with?
One in five people who accessed services reported dissatisfaction with at least one of these services[9]. We followed these people up with a question that asked which aspect of the service they were most dissatisfied with[10]. 11% of people reported their dissatisfaction related to the process, and 9% said that it was related to the information provided.
Figure 3: Reasons for dissatisfaction
Dissatisfaction impacts upon trust. Respondents who reported a decline in trust over the last year often cited dissatisfactory service experiences as the reason.
“I was without any income for 3 months because of the time it took to process my claim. You use to be able to set up a claim approval straight away when you could see someone face to face. 3 months wait put me into severe financial hardship.” – Female, 55, Regional New South Wales, July 2024
“Child support told me several different bits of conflicting information. They also took more money than they said they would.” – Male, 38, Regional Queensland, June 2025
“Nothing seems to work together. It is so hard to work out where I am supposed to go for what service.” – Female, 45, Metro New South Wales, October 2024
“No one listens no one helps and staff are rude.” Male, 49, Regional Victoria, November 2024
How does trust and satisfaction compare across agencies?
Figure 4: Trust and satisfaction across agencies
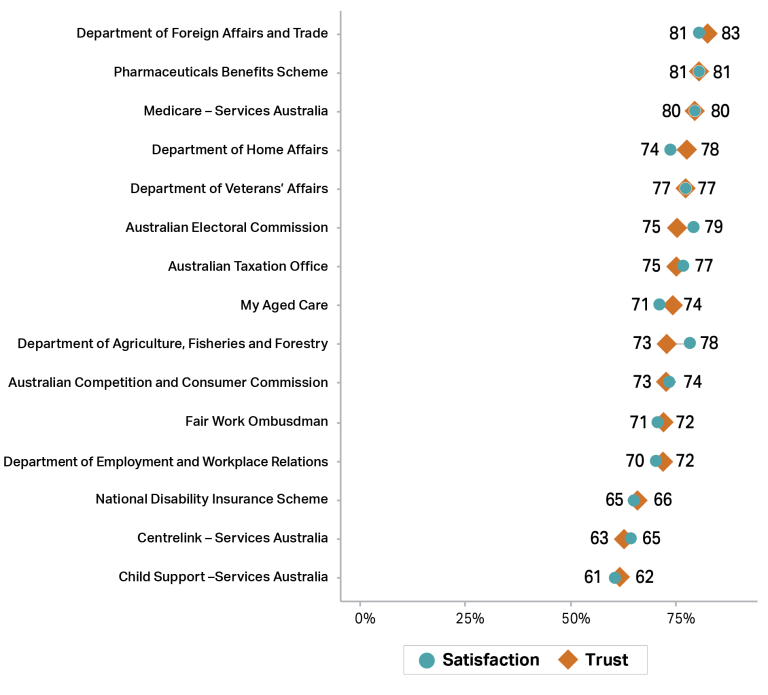
|
Want more detail on services? See the section ‘Trust and satisfaction in each agency’ for more findings and online through our interactive dashboard. |
How does satisfaction compare across similar service activities?
Although Australian public services are different from one another, they often involve similar activities. Comparing satisfaction levels across similar activities may point towards instances of better practice and help services learn from one another.
There are many service activities (as shown on subsequent pages) and ways to compare them. To explore the opportunity this data provides, we look at one example below.
|
Spotlight on applications Filling in an application to receive a service, card, or benefit is one of the most common activities people undertake when accessing services. Table 1 shows people’s satisfaction[12] with different application processes and how this compares to overall satisfaction with the agency/master program. Applying for a PBS Safety Net card tops the list with 86% satisfaction. Although high application satisfaction is a great outcome, it is also meaningful to look at the difference between application satisfaction and overall agency satisfaction to find areas of better practice. For example, satisfaction when applying for a Child Support Assessment was 5% higher than satisfaction for the Child Support program overall. |
Table 1 – Satisfaction of people who completed an application process
| Service activity (an application process) | Agency or master program responsible | Service activity satisfaction | Agency or master program satisfaction | Difference |
|---|---|---|---|---|
| Applied for a PBS Safety Net card | Pharmaceutical Benefits Scheme | 86% | 82% | 4% |
| Sought approval or a permit to bring/mail goods into Australia that could pose a biosecurity risk | Department of Agriculture, Forestry and Fisheries | 85% | 79% | 6% |
| Applied for a passport | Department of Foreign Affairs and Trade | 83% | 84% | -1% |
| Applied for a postal vote | Australian Electoral Commission | 82% | 80% | 2% |
| Lodged or amended an income tax return | Australian Taxation Office | 78% | 77% | 1% |
| Made an application for a Medicare Card | Medicare – Services Australia | 70% | 79% | -9% |
| Applied for Australian citizenship or a visa | Department of Home Affairs | 66% | 72% | -6% |
| Applied to increase or change aged care services | My Aged Care | 60% | 68% | -8% |
| Applied for a Child Support Assessment | Child support –Services Australia | 60% | 55% | 5% |
| Made an application for a payment, subsidy or similar | Centrelink – Services Australia | 58% | 65% | -7% |
| Applied to access the NDIS | National Disability Insurance Scheme | 56% | 56% | 0% |
| Note that agency or master program satisfaction differs from the proportions shown in Figure 4. The proportions in this table are based on a subset of respondents who completed a module on each agency. See technical appendix for more detail. |
Trust and satisfaction in each agency
To better understand the experiences of people accessing services, we ask them about the activities they undertook in relation to the service and the channels by which they accessed services.
Each of the following pages relates to a particular agency (or master program) and comprises three charts:
- trust and satisfaction over time
- trust and satisfaction based on what service-related activities respondents undertook
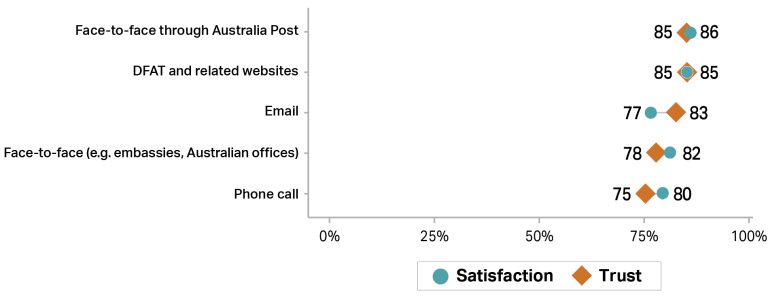
- trust and satisfaction based on what channel respondents accessed services through.
|
Note: Trust[11] and satisfaction[12] relates to the overall service experience. Each data point is based on groupings of people who undertook an activity or accessed services through a channel described in the data label. These people may have undertaken other activities or accessed services through other channels as well. These other experiences would also influence their overall sentiment. |
Australian Competition and Consumer Commission
Figure 5: Australian Competition and Consumer Commission – Change over time
Figure 6: Australian Competition and Consumer Commission – Service activities
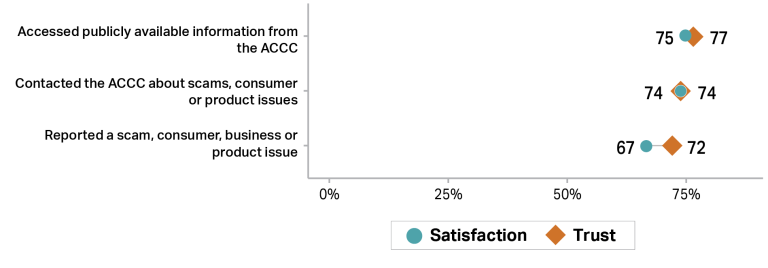
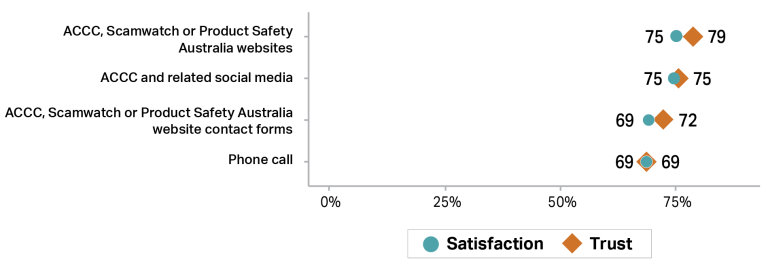
Figure 7: Australian Competition and Consumer Commission – Channels
|
Note: In all instances, trust[11] and satisfaction[12] relates to the overall service experience. Each data point in Figure 6 and Figure 7 is based on groupings of people who undertook an activity or accessed services through a channel described in the data label. These people may have undertaken other activities or accessed services through other channels as well. These other experiences would also influence their overall sentiment. Sample sizes vary. Time-series: from n=173 to 1,575; Service activities: from n=187 to 237; Channels: from n=94 to 229. Charts do not necessarily contain all possible service activities and channels. Activities and channels with sample sizes under n=50 are excluded. Some labels have been shortened for display. See technical appendix for more detail. |
Australian Electoral Commission
Figure 8: Australian Electoral Commission – Change over time
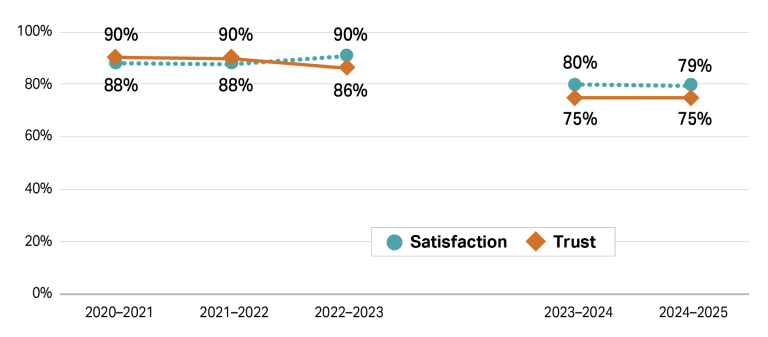
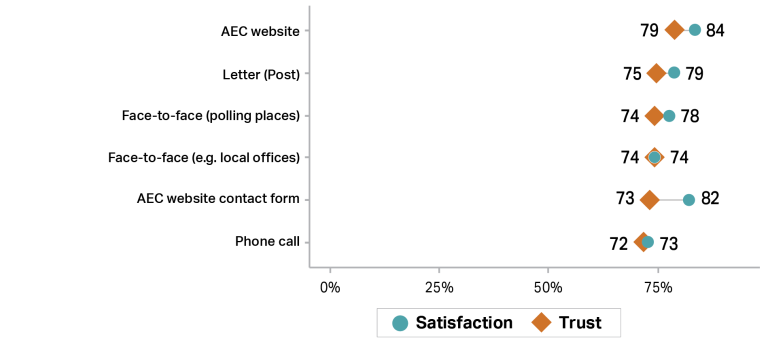
Figure 9: Australian Electoral Commission – Service activities
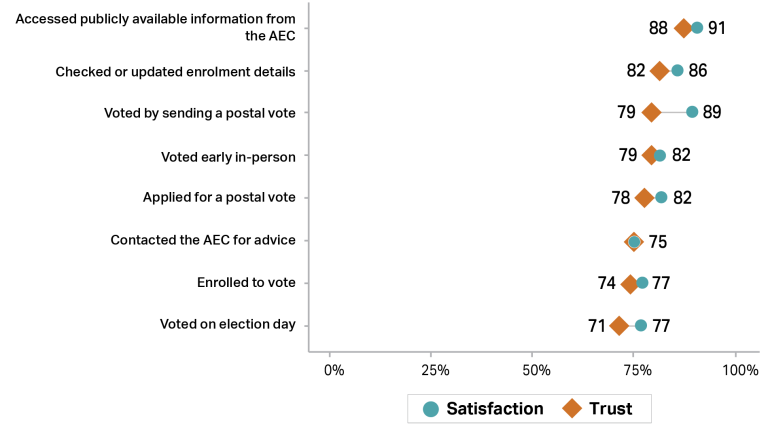
Figure 10: Australian Electoral Commission – Channels
|
Note: In all instances, trust [11] and satisfaction [12] relates to the overall service experience. Each data point in Figure 9 and Figure 10 is based on groupings of people who undertook an activity or accessed services through a channel described in the data label. These people may have undertaken other activities or accessed services through other channels as well. These other experiences would also influence their overall sentiment. A method change affected findings for the Australian Electoral Commission in the 2023-2024 financial year. The change led to over 20 times as many people answering questions about the service. This resulted in reported trust and satisfaction for the agency becoming much more neutral. As such, the 2023–2025 year findings are not directly comparable to previous years. Sample sizes vary. Time-series: from n=98 to 4,907; Service activities: from n=74 to 404; Channels: from n=73 to 567. Charts do not necessarily contain all possible service activities and channels. Activities and channels with sample sizes under n=50 are excluded. Some labels have been shortened for display. See technical appendix for more detail. |
Australian Taxation Office
Figure 11: Australian Taxation Office – Change over time
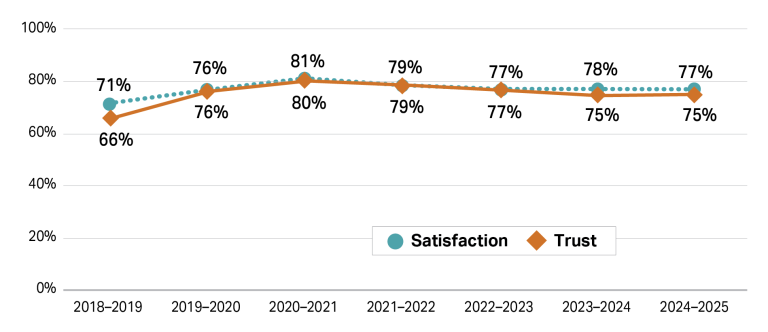
Figure 12: Australian Taxation Office – Service activities
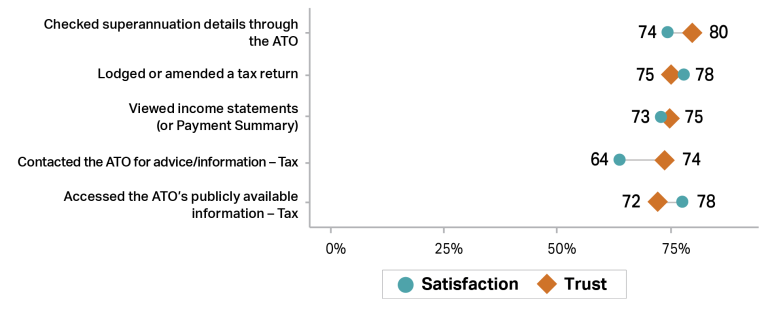
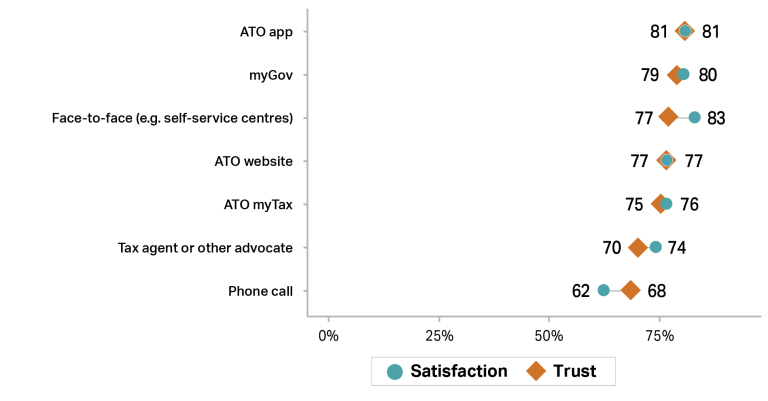
Figure 13: Australian Taxation Office – Channels
|
Note: In all instances, trust [11] and satisfaction [12] relates to the overall service experience. Each data point in Figure 12 and Figure 13 is based on groupings of people who undertook an activity or accessed services through a channel described in the data label. These people may have undertaken other activities or accessed services through other channels as well. These other experiences would also influence their overall sentiment. Sample sizes vary. Time-series: from n=1,932 to 8,148; Service activities: from n=50 to 970; Channels: from n=54 to 474. Charts do not necessarily contain all possible service activities and channels. Activities and channels with sample sizes under n=50 are excluded. Some labels have been shortened for display. See technical appendix for more detail. |
Centrelink – Services Australia
Figure 14: Centrelink – Services Australia – Change over time
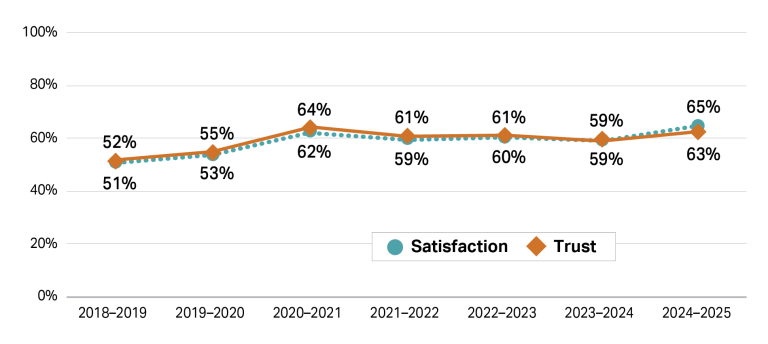
Figure 15: Centrelink – Services Australia – Service activities
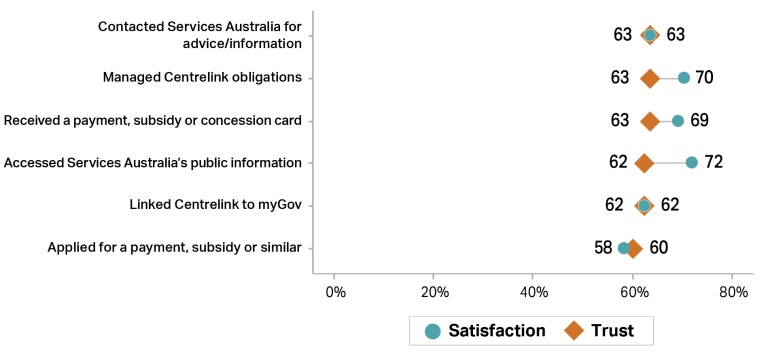
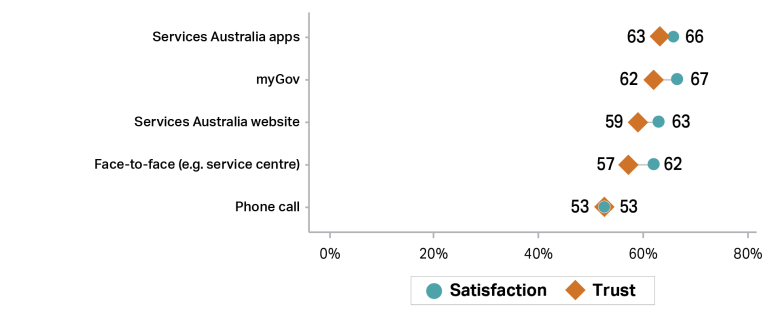
Figure 16: Centrelink – Services Australia – Channels
|
Note: In all instances, trust [11] and satisfaction [12] relates to the overall service experience. Each data point in Figure 15 and Figure 16 is based on groupings of people who undertook an activity or accessed services through a channel described in the data label. These people may have undertaken other activities or accessed services through other channels as well. These other experiences would also influence their overall sentiment. Sample sizes vary. Time-series: from n=1,971 to 6,258; Service activities: from n=63 to 412; Channels: from n=149 to 623. Charts do not necessarily contain all possible service activities and channels. Activities and channels with sample sizes under n=50 are excluded. Some labels have been shortened for display. See technical appendix for more detail. |
Child Support – Services Australia
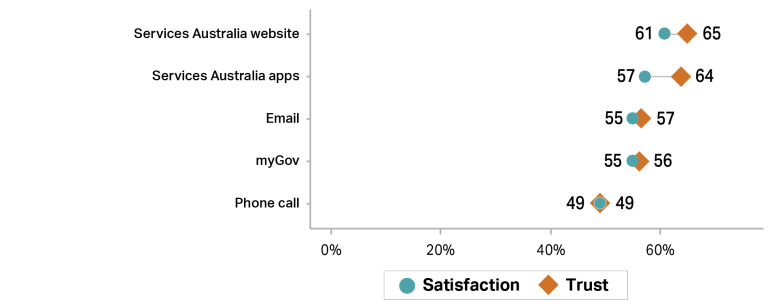
Figure 17: Child Support – Services Australia – Change over time
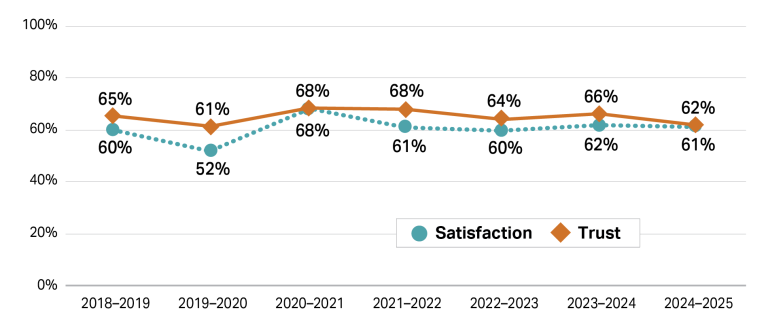
Figure 18: Child Support – Services Australia – Service activities
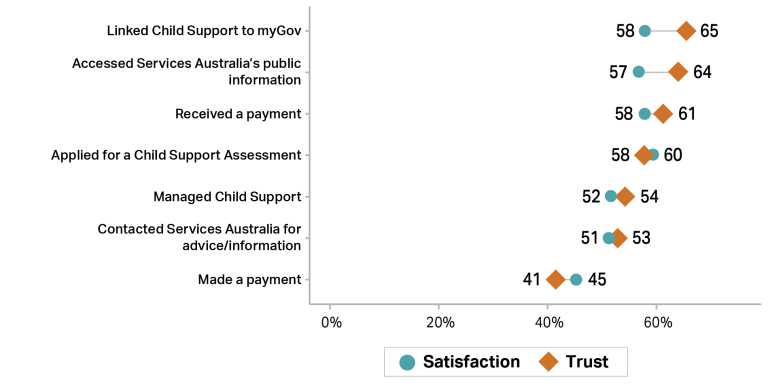
Figure 19: Child Support – Services Australia – Channels
|
Note: In all instances, trust [11] and satisfaction [12] relates to the overall service experience. Each data point in Figure 18 and Figure 19 is based on groupings of people who undertook an activity or accessed services through a channel described in the data label. These people may have undertaken other activities or accessed services through other channels as well. These other experiences would also influence their overall sentiment. Sample sizes vary. Time-series: from n=284 to 1,086; Service activities: from n=62 to 193; Channels: from n=56 to 244. Charts do not necessarily contain all possible service activities and channels. Activities and channels with sample sizes under n=50 are excluded. Some labels have been shortened for display. See technical appendix for more detail. |
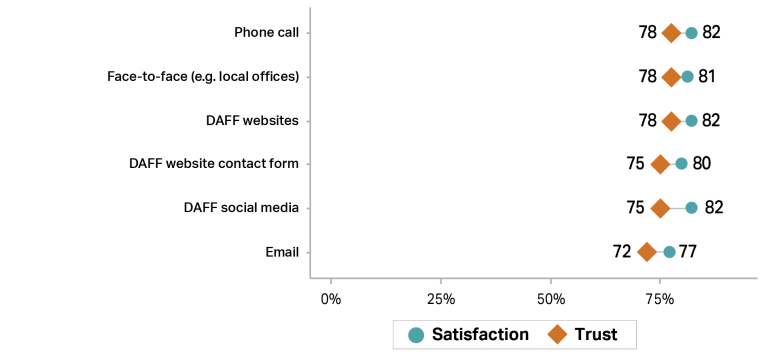
Department of Agriculture, Fisheries and Forestry
Figure 20: Department of Agriculture, Fisheries and Forestry – Change over time
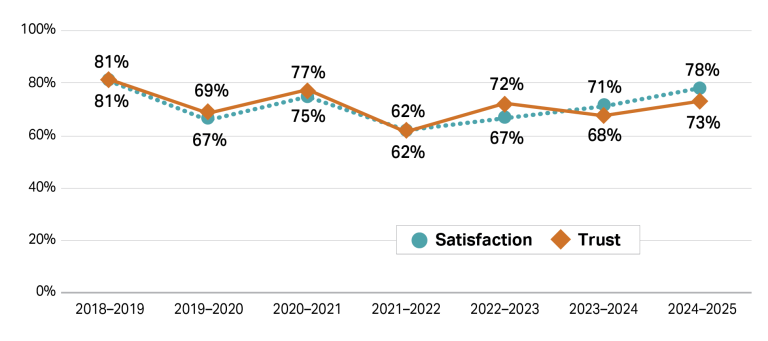
Figure 21: Department of Agriculture, Fisheries and Forestry – Service activities
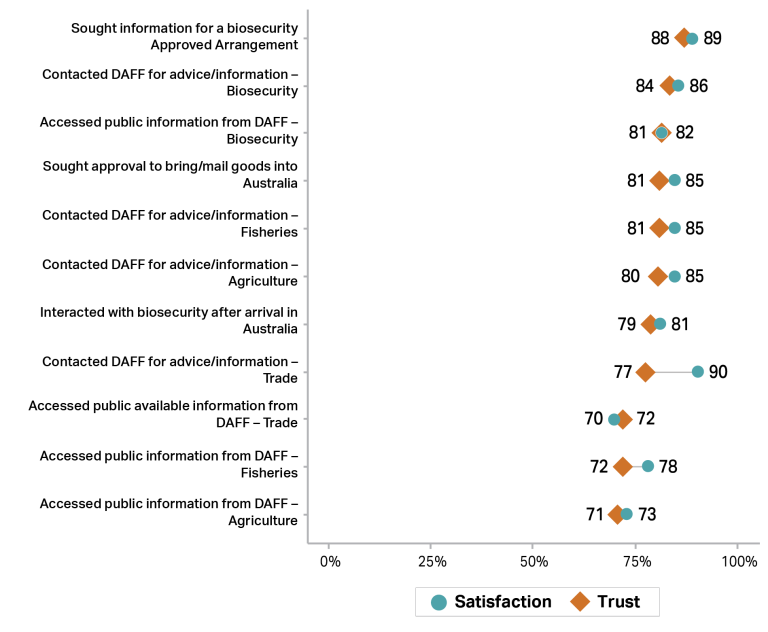
Figure 22: Department of Agriculture, Fisheries and Forestry – Channels
|
Note: In all instances, trust [11] and satisfaction [12] relates to the overall service experience. Each data point in Figure 21 and Figure 22 is based on groupings of people who undertook an activity or accessed services through a channel described in the data label. These people may have undertaken other activities or accessed services through other channels as well. These other experiences would also influence their overall sentiment. Sample sizes vary. Time-series: from n=79 to 718; Service activities: from n=55 to 140; Channels: from n=100 to 191. Charts do not necessarily contain all possible service activities and channels. Activities and channels with sample sizes under n=50 are excluded. Some labels have been shortened for display. See technical appendix for more detail. |
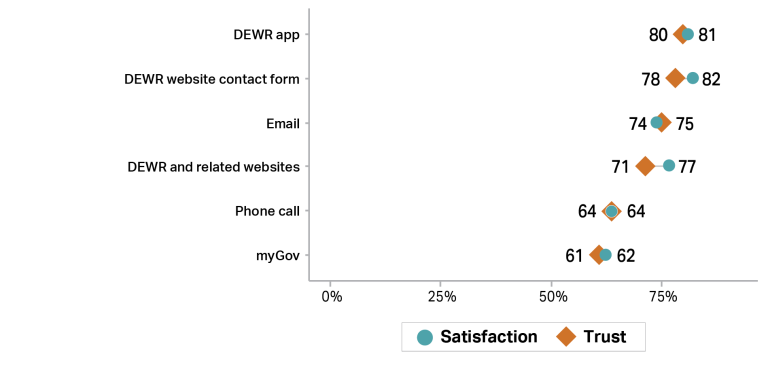
Department of Employment and Workplace Relations
Figure 23: Department of Employment and Workplace Relations – Change over time
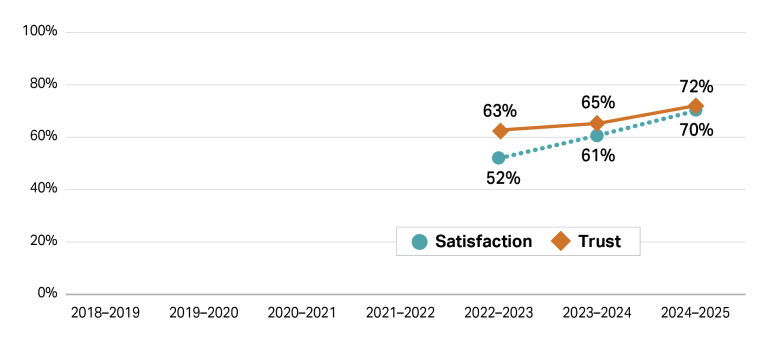
Figure 24: Department of Employment and Workplace Relations – Service activities
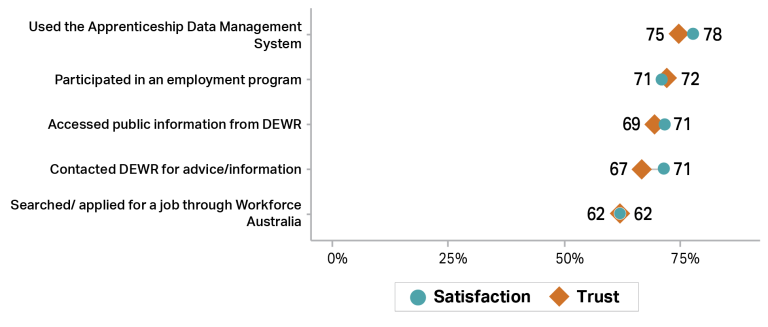
Figure 25: Department of Employment and Workplace Relations – Channels
|
Note: In all instances, trust [11] and satisfaction [12] relates to the overall service experience. Department of Employment and Workplace Relations was created in the FY2022-23 as a result of machinery of government changes. Each data point in Figure 24 and Figure 25 is based on groupings of people who undertook an activity or accessed services through a channel described in the data label. These people may have undertaken other activities or accessed services through other channels as well. These other experiences would also influence their overall sentiment. Sample sizes vary. Time-series: from n=198 to 1,295; Service activities: from n=70 to 268; Channels: from n=65 to 267. Charts do not necessarily contain all possible service activities and channels. Activities and channels with sample sizes under n=50 are excluded. Some labels have been shortened for display. See technical appendix for more detail. |
Department of Foreign Affairs and Trade
Figure 26: Department of Foreign Affairs and Trade – Change over time
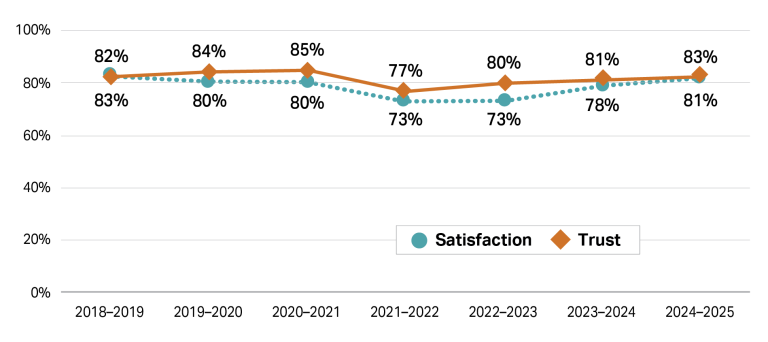
Figure 27: Department of Foreign Affairs and Trade – Service activities
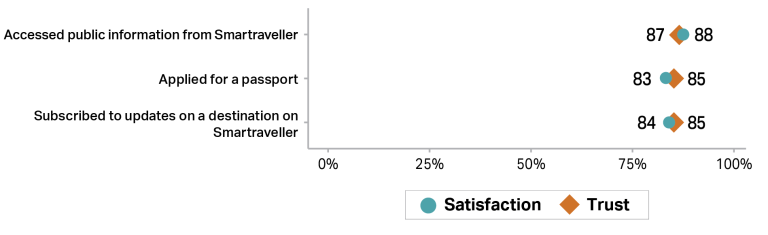
Figure 28: Department of Foreign Affairs and Trade – Channels
|
Note: In all instances, trust [11] and satisfaction [12] relates to the overall service experience. Each data point in Figure 27 and Figure 28 is based on groupings of people who undertook an activity or accessed services through a channel described in the data label. These people may have undertaken other activities or accessed services through other channels as well. These other experiences would also influence their overall sentiment. Sample sizes vary. Time-series: from n=216 to 1,347; Service activities: from n=68 to 163; Channels: from n=51 to 284. Charts do not necessarily contain all possible service activities and channels. Activities and channels with sample sizes under n=50 are excluded. Some labels have been shortened for display. See technical appendix for more detail. |
Department of Home Affairs
Figure 29: Department of Home Affairs – Change over time
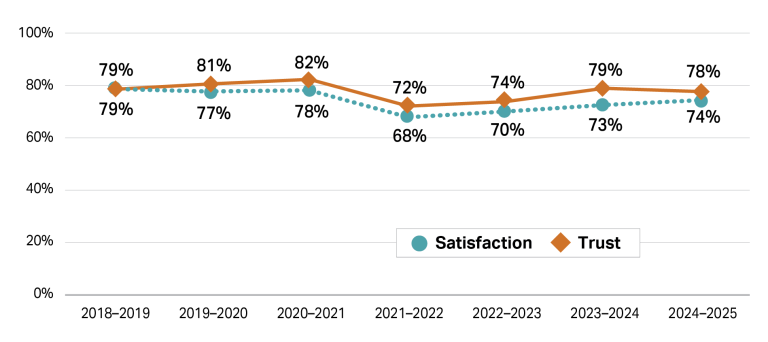
Figure 30: Department of Home Affairs – Service activities
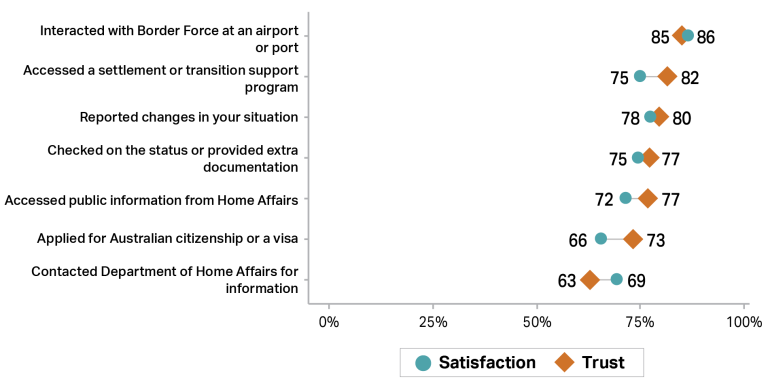
Figure 31: Department of Home Affairs – Channels
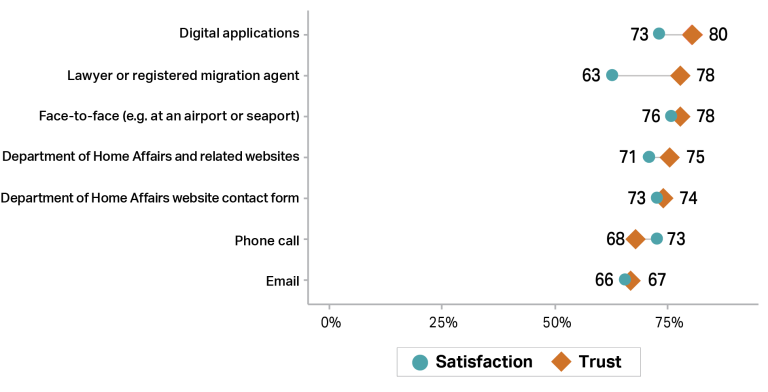
|
Note: In all instances, trust [11] and satisfaction [12] relates to the overall service experience. Each data point in Figure 30 and Figure 31 is based on groupings of people who undertook an activity or accessed services through a channel described in the data label. These people may have undertaken other activities or accessed services through other channels as well. These other experiences would also influence their overall sentiment. Sample sizes vary. Time-series: from n=220 to 1,358; Service activities: from n=58 to 341; Channels: from n=78 to 160. Charts do not necessarily contain all possible service activities and channels. Activities and channels with sample sizes under n=50 are excluded. Some labels have been shortened for display. See technical appendix for more detail. |
Department of Veterans’ Affairs
Figure 32: Department of Veterans’ Affairs – Change over time
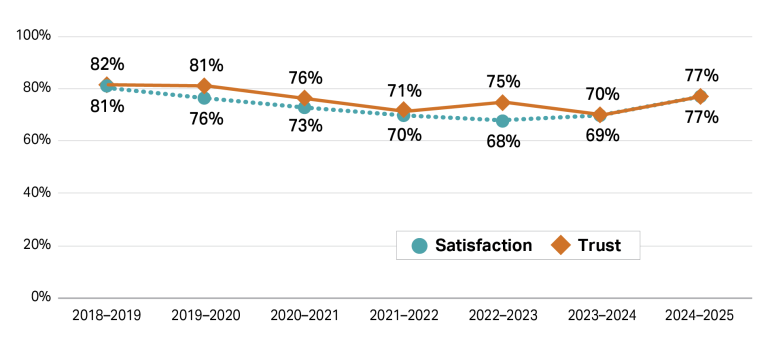
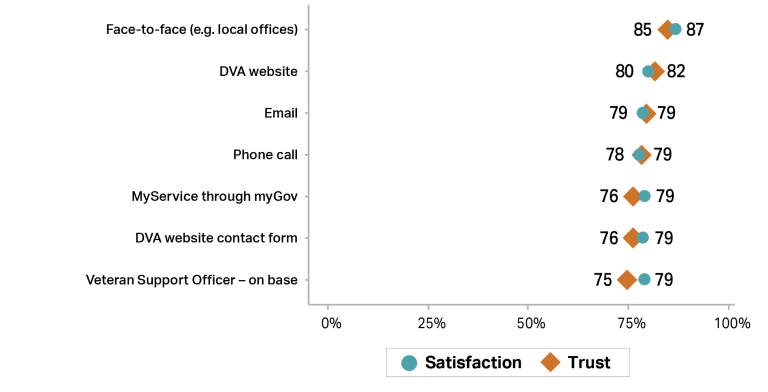
Figure 33: Department of Veterans’ Affairs – Service activities
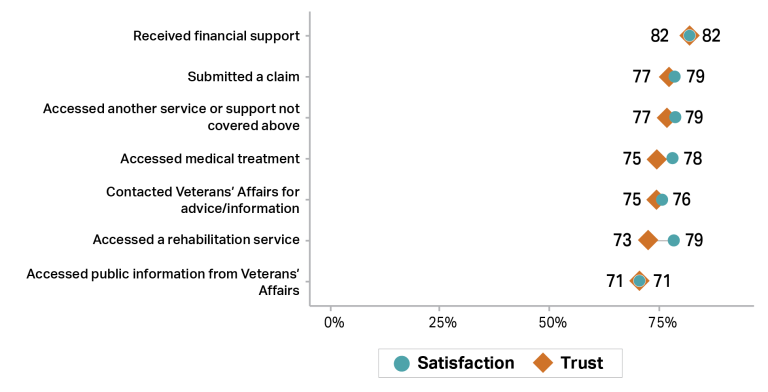
Figure 34: Department of Veterans’ Affairs – Channels
|
Note: In all instances, trust [11] and satisfaction [12] relates to the overall service experience. Each data point in Figure 33 and Figure 34 is based on groupings of people who undertook an activity or accessed services through a channel described in the data label. These people may have undertaken other activities or accessed services through other channels as well. These other experiences would also influence their overall sentiment. Sample sizes vary. Time-series: from n=121 to 530; Service activities: from n=67 to 157; Channels: from n=86 to 192. Charts do not necessarily contain all possible service activities and channels. Activities and channels with sample sizes under n=50 are excluded. Some labels have been shortened for display. See technical appendix for more detail. |
Fair Work Ombudsman
Figure 35: Fair Work Ombudsman – Change over time
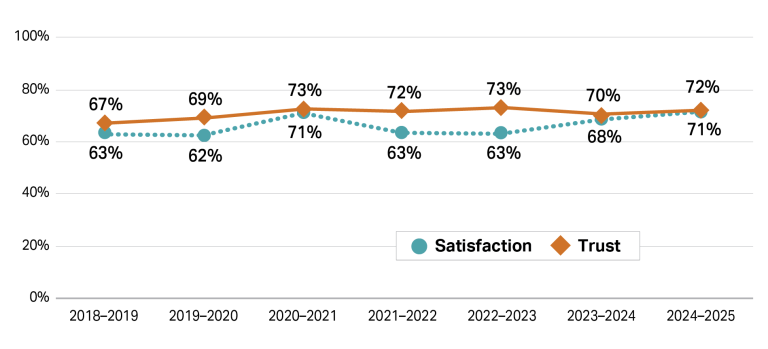
Figure 36: Fair Work Ombudsman – Service activities
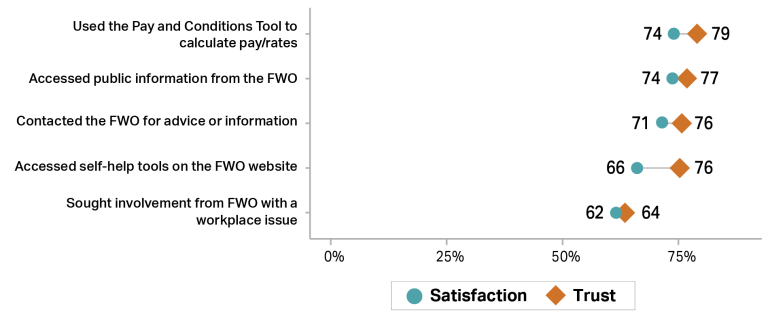
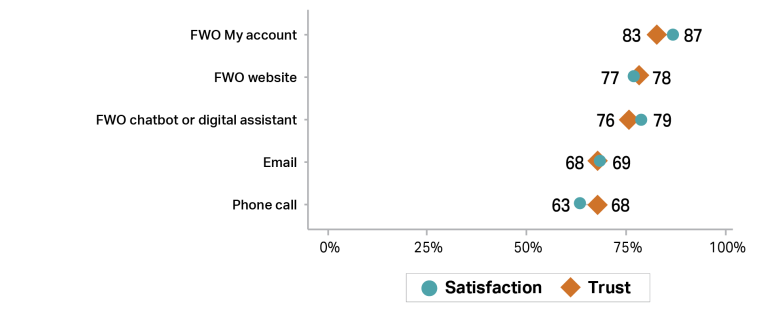
Figure 37: Fair Work Ombudsman – Channels
|
Note: In all instances, trust [11] and satisfaction [12] relates to the overall service experience. Each data point in Figure 36 and Figure 37 is based on groupings of people who undertook an activity or accessed services through a channel described in the data label. These people may have undertaken other activities or accessed services through other channels as well. These other experiences would also influence their overall sentiment. Sample sizes vary. Time-series: from n=118 to 1,268; Service activities: from n=109 to 246; Channels: from n=61 to 296. Charts do not necessarily contain all possible service activities and channels. Activities and channels with sample sizes under n=50 are excluded. Some labels have been shortened for display. See technical appendix for more detail. |
Medicare – Services Australia
Figure 38: Medicare – Services Australia – Change over time
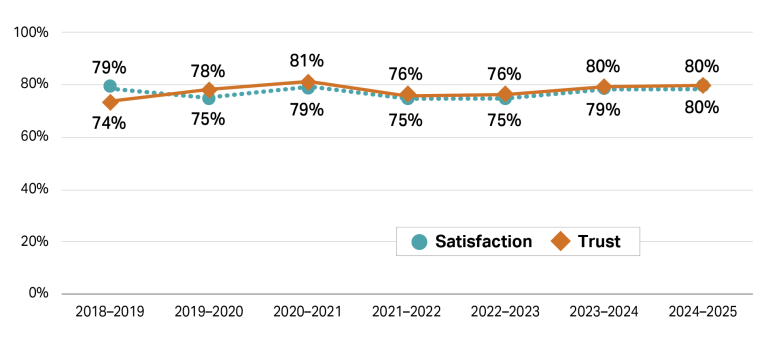
Figure 39: Medicare – Services Australia – Service activities
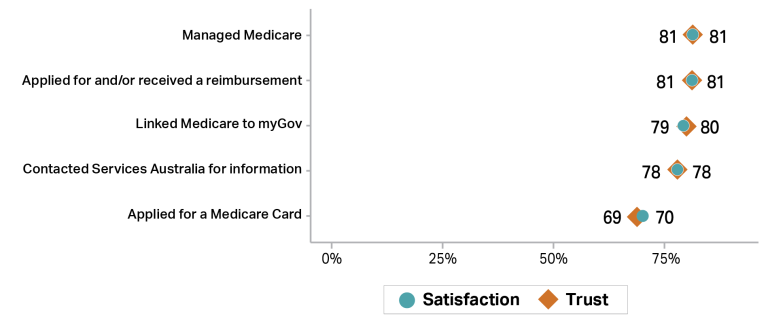
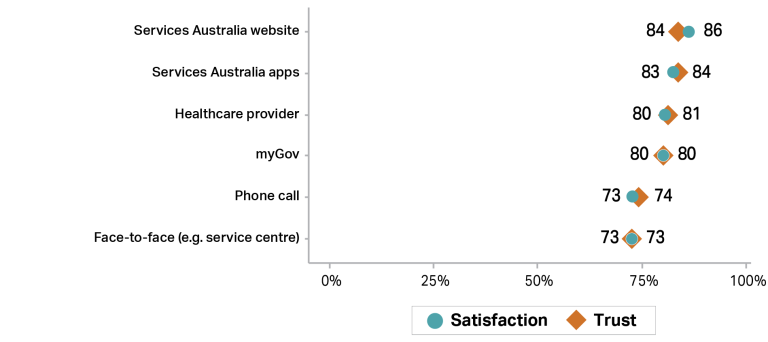
Figure 40: Medicare – Services Australia – Channels
|
Note: In all instances, trust [11] and satisfaction [12] relates to the overall service experience. Each data point in Figure 39 and Figure 40 is based on groupings of people who undertook an activity or accessed services through a channel described in the data label. These people may have undertaken other activities or accessed services through other channels as well. These other experiences would also influence their overall sentiment. Sample sizes vary. Time-series: from n=1,584 to 8,034; Service activities: from n=55 to 442; Channels: from n=108 to 644. Charts do not necessarily contain all possible service activities and channels. Activities and channels with sample sizes under n=50 are excluded. Some labels have been shortened for display. See technical appendix for more detail. |
My Aged Care
Figure 41: My Aged Care – Change over time
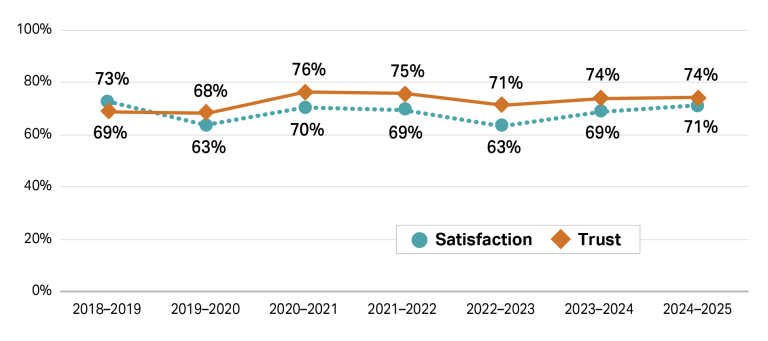
Figure 42: My Aged Care – Service activities
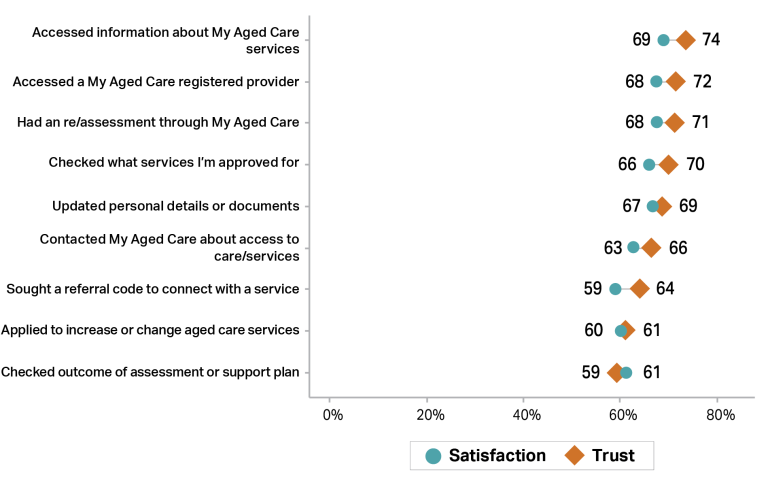
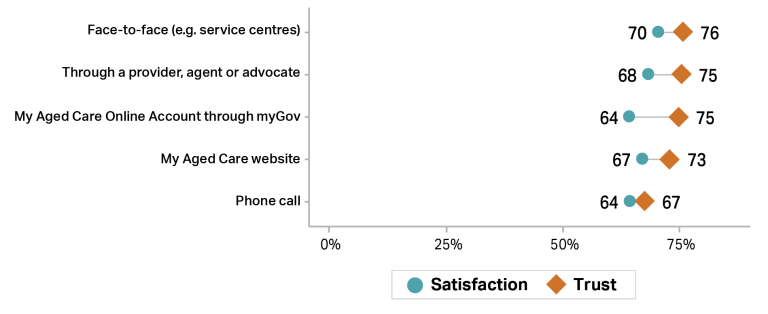
Figure 43: My Aged Care – Channels
|
Note: In all instances, trust [11] and satisfaction [12] relates to the overall service experience. Each data point in Figure 42 and Figure 43 is based on groupings of people who undertook an activity or accessed services through a channel described in the data label. These people may have undertaken other activities or accessed services through other channels as well. These other experiences would also influence their overall sentiment. Sample sizes vary. Time-series: from n=240 to 1,397; Service activities: from n=63 to 305; Channels: from n=111 to 374. Charts do not necessarily contain all possible service activities and channels. Activities and channels with sample sizes under n=50 are excluded. Some labels have been shortened for display. See technical appendix for more detail. |
National Disability Insurance Scheme
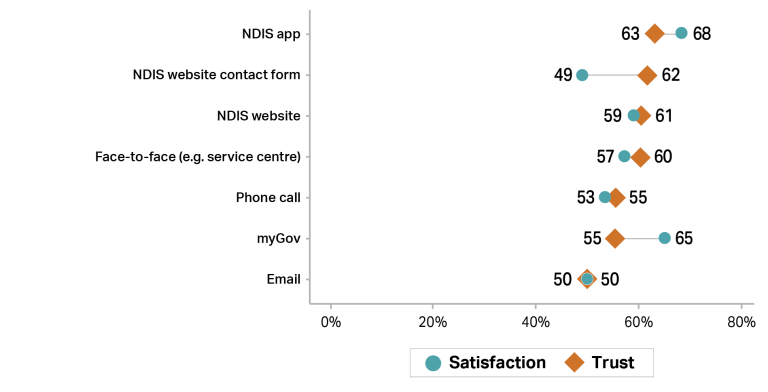
Figure 44: National Disability Insurance Scheme – Change over time
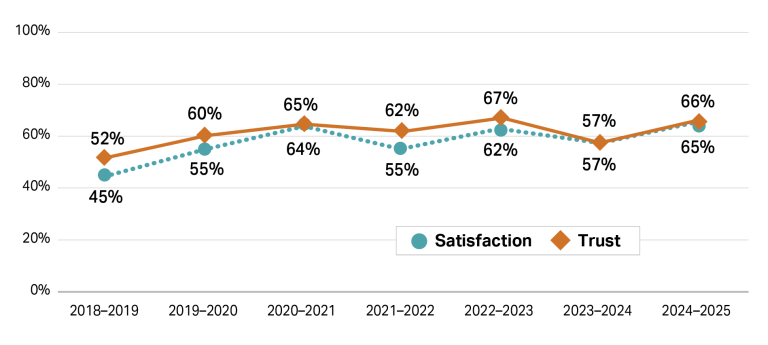
Figure 45: National Disability Insurance Scheme – Service activities
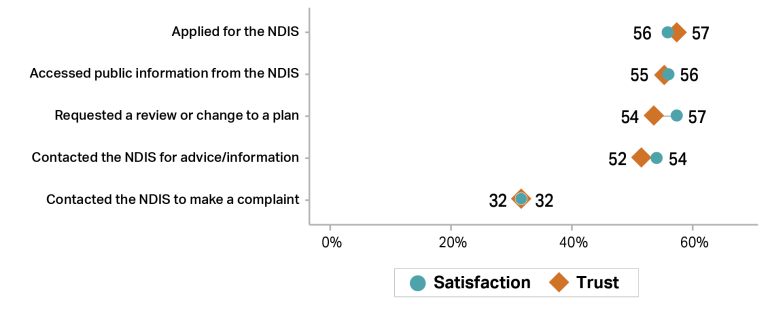
Figure 46: National Disability Insurance Scheme – Channels
|
Note: In all instances, trust [11] and satisfaction [12] relates to the overall service experience. Each data point in Figure 45 and Figure 46 is based on groupings of people who undertook an activity or accessed services through a channel described in the data label. These people may have undertaken other activities or accessed services through other channels as well. These other experiences would also influence their overall sentiment. Sample sizes vary. Time-series: from n=205 to 1,222; Service activities: from n=77 to 241; Channels: from n=53 to 288. Charts do not necessarily contain all possible service activities and channels. Activities and channels with sample sizes under n=50 are excluded. Some labels have been shortened for display. See technical appendix for more detail. |
Pharmaceuticals Benefits Scheme
Figure 47: Pharmaceuticals Benefits Scheme – Change over time
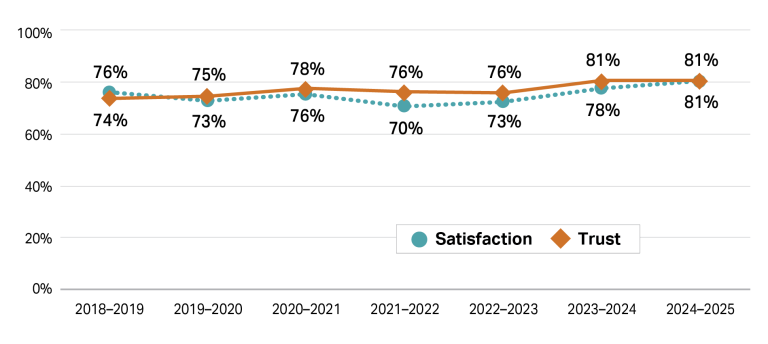
Figure 48: Pharmaceuticals Benefits Scheme – Service activities
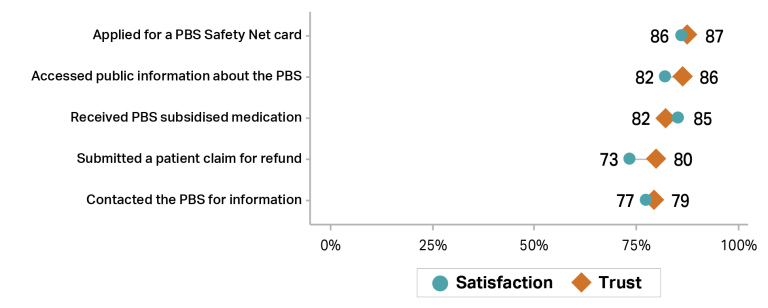
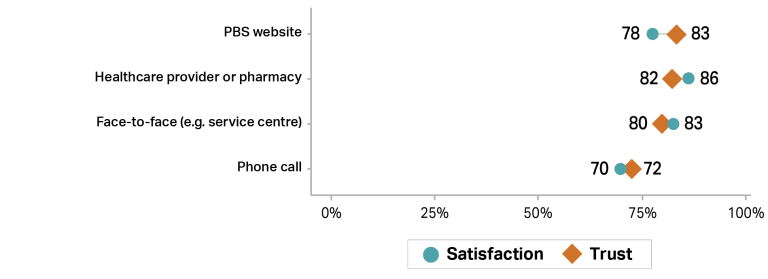
Figure 49: Pharmaceuticals Benefits Scheme – Channels
|
Note: In all instances, trust [11] and satisfaction [12] relates to the overall service experience. Each data point in Figure 48 and Figure 49 is based on groupings of people who undertook an activity or accessed services through a channel described in the data label. These people may have undertaken other activities or accessed services through other channels as well. These other experiences would also influence their overall sentiment. Sample sizes vary. Time-series: from n=290 to 2,349; Service activities: from n=67 to 515; Channels: from n=81 to 427. Charts do not necessarily contain all possible service activities and channels. Activities and channels with sample sizes under n=50 are excluded. Some labels have been shortened for display. See technical appendix for more detail. |
OECD Report: Drivers of Trust in Public Institutions in Australia
As part of the Australian Government’s commitment to trust-enhancing reforms and democratic principles, Australia commissioned the OECD to undertake the Drivers of Trust in Public Institutions in Australia country study, which was published in March 2025 – following fellow OECD member countries: Korea in 2018, Finland in 2021, Norway in 2022, New Zealand and Brazil in 2023, and Chile in 2024.
The report draws on data from the 2021 and 2023 OECD Global Trust Surveys, delving deeper into analysis of the drivers of trust, and complements this quantitative investigation with interviews of key stakeholders from public institutions, academics, and civil society in Australia.
Key findings:
- Australia is a trusting and cohesive society grappling with contemporary challenges and historical legacies. In Australia, 46% of people expressed high to moderately high trust in government in 2023, surpassing the OECD average of 39%. This represents an eight-percentage point increase from 2021.
- Trust in government rose across most population groups since 2021. However, trust levels are consistently lower among those experiencing financial stress, individuals with lower education levels, people who identify as belonging to discriminated-against groups, and women.
- Australians expressed above-average satisfaction with services such as education (71%) and healthcare (64%), however administrative service satisfaction (68%) only just exceeds the OECD average.
- The biggest trust gap (52 percentage points) exists between those who feel “people like them” have a say in what the government does, and those who do not.
Drivers of trust
- Drivers of trust vary across institutions, suggesting different trust-building strategies are needed for different institutions.
- Satisfaction with administrative services correlates with increased trust across all Australian public institutions, and more so than in other OECD countries, while perceived innovation drives trust specifically in the federal government and Parliament.
- Trust in the Australian Public Service is strongly linked to perceptions that it considers long-term societal interests and provides honest advice.
- Trust in federal government and Parliament is closely tied to perceptions of fairness and integrity, while local government trust is driven to a larger extent by openness.
Footnotes
[1] Q7 – Overall trust is the proportion of people who answered “Strongly agree” or “Agree” when asked “How much do you agree with the following statement – ‘I can trust Australian public services’”.
[4] Q27 – Proportion of people who answered “Strongly agree” or “Agree” when asked how much they agreed with statements about their service experience. The proportion is adjusted pro rata for the amount of services each individual was asked about.
[5] Q27 – Proportion of people who answered “Strongly disagree” or “Disagree” when asked how much they agreed with statements about their service experience. The proportion is adjusted pro rata for the amount of services each individual was asked about.
[7] Q36 – Life satisfaction is the proportion of people who answered “Completely satisfied” or “Satisfied” when asked “Overall how satisfied or dissatisfied are you with life as a whole these days?”
[8] Q37 – Trust in other people is the proportion of people who answered “Strongly agree” or “Agree” when asked “How much do you agree or disagree with the following statement – ‘Most people can be trusted’”.
[9] Q23 – Dissatisfaction with a service is the proportion of people who answered “Completely dissatisfied” or “Dissatisfied” when asked “Thinking about your experience with the services you accessed from each of the following, how satisfied or dissatisfied are you?”
[10] Q24 – Proportion of people who answered each statement in the graph for at least one service they accessed when asked “Thinking about your experience with each of the services you accessed, what were you most dissatisfied with?” The question was only asked of people who answered “Completely dissatisfied” or “Dissatisfied” to Q23 (see note ix).
[11] Q26 – Trust in a service is the proportion of people who answered “Strongly agree” or “Agree” when asked “Thinking about your experience with each of the services you accessed, how much do you agree or disagree with the following statement? “The service is trustworthy”” about each individual agency / master program.
[12] Q23 – Satisfaction with a service is the proportion of people who answered “Very satisfied” or “Satisfied” when asked “Thinking about your experience with the services you accessed from each of the following, how satisfied or dissatisfied are you?” about each individual agency / master program.