


Headline results
In 2025…

|
62%[1] of people reported trusting public services, while only 12%[6] reported distrust. 69%[3] of people who accessed public services reported being satisfied with them. |

|
87% of people who reported trusting public services were also satisfied with them, while 28% of people who distrusted services were still satisfied with services. |
|
How do we compare? OECD Report: Drivers of Trust in Public Institutions in Australia In March 2025, the OECD launched Drivers of Trust in Public Institutions in Australia. The report expands on previous OECD survey findings and provides deeper analysis. Key findings include:
New Zealand’s Kiwis Count Survey
|
Trust and satisfaction have increased
Trust[1] in and satisfaction[3] with Australian public services have increased for the first time since the COVID-19 pandemic. The increase in trust takes it up to match the peak during the pandemic, at 62%.
The survey asked respondents to consider their experiences with services in the past year. Thus, the increase in trust and satisfaction reflects changes which have occurred since July 2023, and are not attributable only to changes in the financial year just passed nor necessarily owing to recent events. Based on analysis of open-ended responses to a question asking respondents why their trust has increased, answers point to various sustained improvements in service delivery.
Figure 1: Trust and satisfaction over time
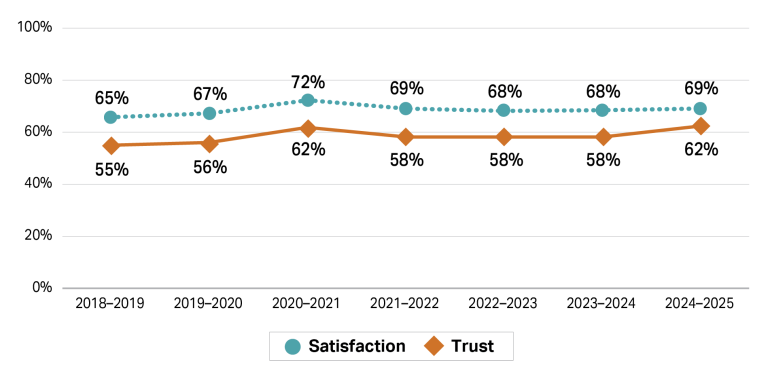
| Note that a change in the way we asked respondents about their satisfaction with services may influence comparisons to previous years. See the technical appendix for more details. |
Why has trust and satisfaction increased?
Since October 2023, we have been asking respondents how their trust in Australian public services compared to a year prior. For those who tell us it has either increased or decreased, we ask why. Among those reporting an increase in trust, the common themes highlighted were:
- reduced wait times
- improved digital services
- greater transparency and communication
- improved service quality and staff helpfulness.
“I am more trusting with the public services now than over a year ago when I had a bad experience with Centrelink. It was challenging back then just getting into the system. I was constantly dealing with different people everytime and was given different information. Now I'm in the system, it's easier, I can access information through the myGov portal and I can book a phone call instead on waiting on the phone for long periods of time. The people I have communicated with recently have been very helpful, easy to understand and asked if there were any other inquires” – Female, 51, Regional Victoria, September 2024
“Long phone wait times previously cause the online portals did not answer my questions. Now it's easy to get information via online portal” – Male, 48, Metro South Australia, May 2025
“I had heard of lots of stories about how long getting a low income card took and also applying for the pension took. I did not experience this as the person I spoke to on the phone prior to my appointment gave me all the information I needed to have with me for my appointment. It was quite straight forward” – Female, 65, Metro Queensland, January 2025
“During my conversation I was treated with respect and dignity. I was given more information that helped me understand what I was enquiring about and I felt reassured. I never felt this way last year. I feel more assured calling or dealing with the Australian public service that next time should the need arise” – Male, 63, Regional New South Wales, November 2024
Despite there being significant global attention on public services since October 2024, no respondents attributed a shift in their trust to international events in the media. Respondents predominantly described their personal experiences with services as the basis for changes in sentiment.
Footnotes
[1] Q7 – Overall trust is the proportion of people who answered “Strongly agree” or “Agree” when asked “How much do you agree with the following statement – ‘I can trust Australian public services’”.
[3] Q22 – Satisfaction is the proportion of people who answered “Completely satisfied” or “Satisfied” when asked “Thinking about your overall experience with the above services, how satisfied or dissatisfied are you?”
[6] Q7 – Distrust is the proportion of people who answered “strongly disagree” or “disagree” when asked “How much do you agree with the following statement – ‘I can trust Australian public services’”.