


APS at a glance
Figure 7: APS at a glance data (at 30 June 2024)
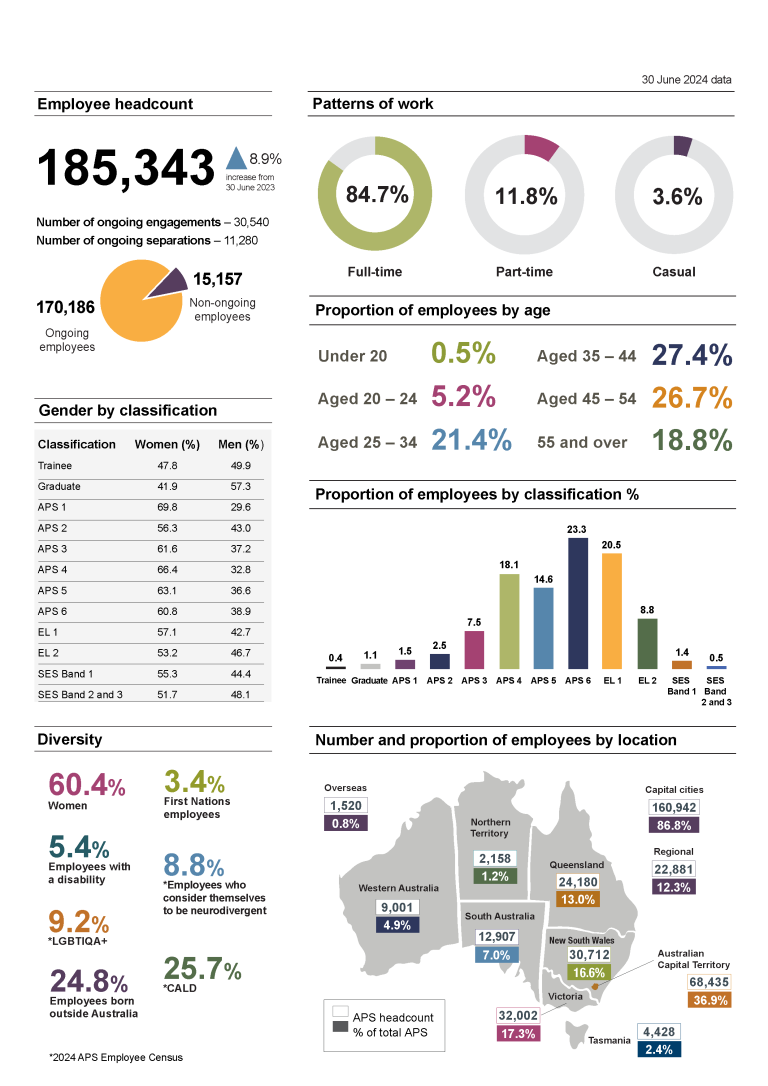
Sources: APS Employment Database (APSED) and APS Employee Census
Table 1: APS employee headcount (at 30 June 2024)
| Employee type | Number and percentage (%) |
|---|---|
| APS employee headcount | 185,343 |
| Percentage increase from 30 June 2023 | 8.9% |
| Number of ongoing engagements | 30,540 |
| Number of ongoing separations | 11,280 |
Sources: APSED
Table 2: Ongoing and non-ongoing APS employees (at 30 June 2024)
| Employee type | Number |
|---|---|
| Number of ongoing employees | 170,186 |
| Number of non-ongoing employees | 15,157 |
Sources: APSED
Table 3: Patterns of work as a proportion of total APS (at 30 June 2024)
| Proportion of total APS | Percentage (%) |
|---|---|
| Full-time | 84.7 |
| Part-time | 11.8 |
| Casual | 3.6 |
Sources: APSED
Table 4: Proportion of APS employees by age group (at 30 June 2024)
| Age group | Percentage (%) |
|---|---|
| Under 20 | 0.5 |
| 20ꟷ24 | 5.2 |
| 25ꟷ34 | 21.4 |
| 35ꟷ44 | 27.4 |
| 45ꟷ54 | 26.7 |
| 55 and over | 18.8 |
Sources: APSED
Table 5: Proportion of APS employees by classification (at 30 June 2024)
| Classification | Percentage (%) |
|---|---|
| Trainee | 0.4 |
| Graduate | 1.1 |
| APS 1 | 1.5 |
| APS 2 | 2.5 |
| APS 3 | 7.5 |
| APS 4 | 18.1 |
| APS 5 | 14.6 |
| APS 6 | 23.3 |
| EL 1 | 20.5 |
| EL 2 | 8.8 |
| SES Band 1 | 1.4 |
| SES Band 2 and 3 | 0.5 |
Sources: APSED
Note: EL = Executive Level; SES = Senior Executive Service.
Table 6: Number and proportion of APS employees by location (at 30 June 2024)
| Location | Number | Percentage (%) |
|---|---|---|
| Australian Capital Territory | 68,435 | 36.9 |
| Victoria | 32,002 | 17.3 |
| New South Wales | 30,712 | 16.6 |
| Queensland | 24,180 | 13.0 |
| South Australia | 12,907 | 7.0 |
| Western Australia | 9,001 | 4.9 |
| Tasmania | 4,428 | 2.4 |
| Northern Territory | 2,158 | 1.2 |
| Total capital cities | 160,942 | 86.8 |
| Total regional | 22,881 | 12.3 |
| Overseas | 1,520 | 0.8 |
| All | 185,343 | 100.0 |
Sources: APSED
Note: Totals may not sum due to rounding.
Table 7: Gender by APS role classification as a percentage of women and men (at 30 June 2024)
| Classification | Women (%) | Men (%) |
|---|---|---|
| Trainee | 47.8 | 49.9 |
| Graduate | 41.9 | 57.3 |
| APS 1 | 69.8 | 29.6 |
| APS 2 | 56.3 | 43.0 |
| APS 3 | 61.6 | 37.2 |
| APS 4 | 66.4 | 32.8 |
| APS 5 | 63.1 | 36.6 |
| APS 6 | 60.8 | 38.9 |
| EL 1 | 57.1 | 42.7 |
| EL 2 | 53.2 | 46.7 |
| SES Band 1 | 55.3 | 44.4 |
| SES Band 2 and 3 | 51.7 | 48.1 |
Sources: APSED
Table 8: Diversity
| Diversity group | Percentage (%) |
|---|---|
| First Nations employees (APSED, 30 June 2024) |
3.4 |
| Employees born outside Australia (APSED, 30 June 2024) |
24.8 |
| Employees who identify as culturally and linguistically diverse (CALD) (2024 APS Employee Census) |
25.7 |
| Employees with a disability (APSED, 30 June 2024) |
5.4 |
| Employees who consider themselves to be neurodivergent (2024 APS Employee Census) |
8.8 |
| Employees who identify as LGBTIQA+ (lesbian, gay, bisexual, transgender, intersex, queer, asexual and other sexually or gender diverse) (2024 APS Employee Census) |
9.2 |
| Women (APSED, 30 June 2024) |
60.4 |
Sources: APSED and APS Employee Census