APS at a glance

| 
|
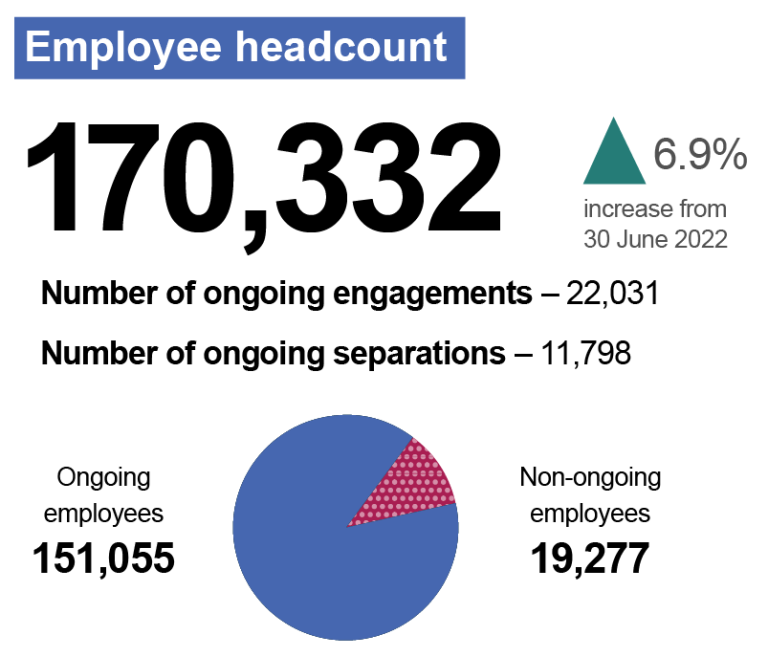
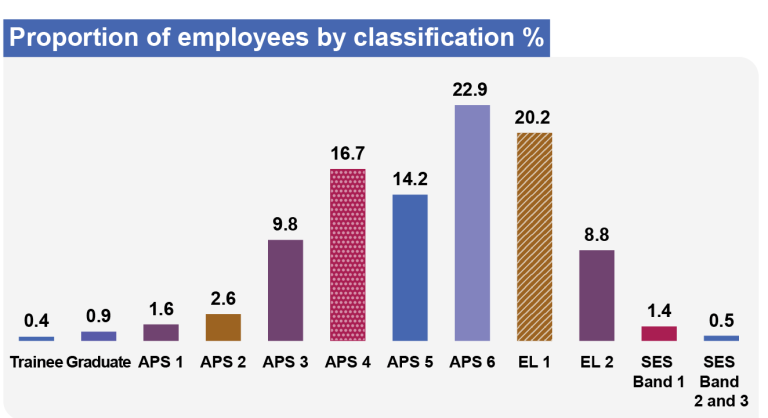
30 June 2023 data


|
|
|
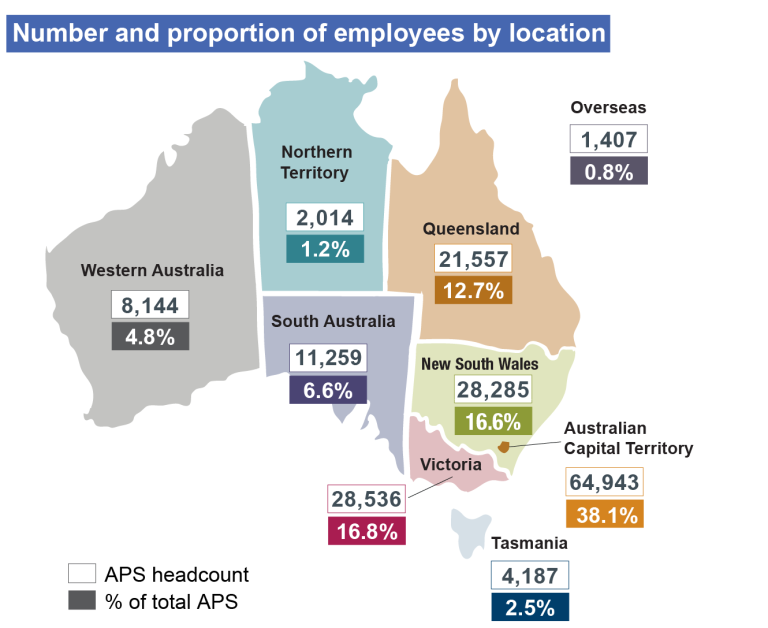
30 June 2023 data
The APSC acknowledges the Traditional Custodians of Country throughout Australia and recognises the continuing connection to lands, waters and communities. We pay our respect to Aboriginal and Torres Strait Islander cultures and to Elders both past and present.