


At a glance 2023
| All remuneration components, weighted median change 2022 to 2023 |
|||
|---|---|---|---|
| Classification | non-SES | SES | All |
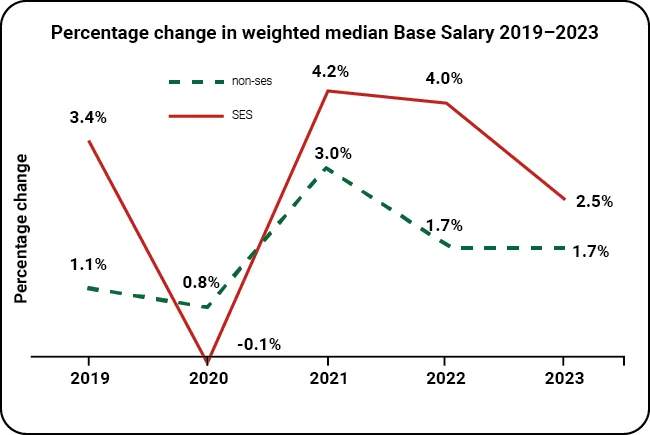
| Base Salary | 1.7% | 2.5% | 1.8% |
| Total Remuneration Package |
1.9% | 1.5% | 1.9% |
| Total Reward | 1.7% | 1.4% | 1.7% |
| Average Base Salary, comparison by gender | |||
|---|---|---|---|
| Classification | Gender | Average Base Salary | % difference between genders |
| APS 4 | Male | $76,454 | -0.1% |
| Female | $76,520 | ||
| APS 5 | Male | $84,838 | -0.1% |
| Female | $84,912 | ||
| APS 6 | Male | $98,834 | 0.4% |
| Female | $98,417 | ||
| EL1 | Male | $124,721 | 0.3% |
| Female | $124,342 | ||
Note: APS 4-APS 6 and EL 1 classifications make up 78% of APS employees. The % difference between genders is the difference between male and female average Base salaries expressed as a % of male earnings.
Note: The 2023 APS remuneration data, initially released on 7 August 2024, has been revised resulting in minor changes to some Total Remuneration Package and Total Reward percentiles and averages for the 2023 reporting year. The updates are primarily due to the correction of SES superannuation amounts after one agency identified an error in its superannuation data. These changes had a small impact on the median percentage movement for SES Total Remuneration Package and Total Reward from 2022 to 2023. Updated data tables are available at Appendix 3.