



Trust and satisfaction in each agency
To better understand the experiences of people accessing services, we ask them about the activities they undertook in relation to the service and the channels by which they accessed services.
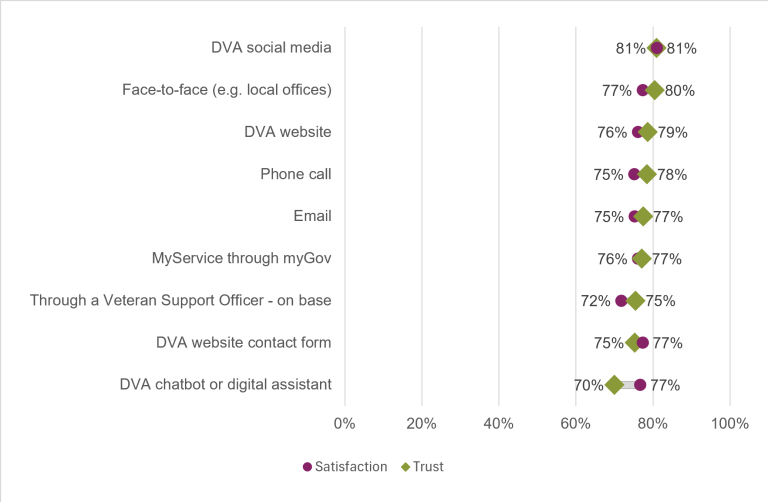
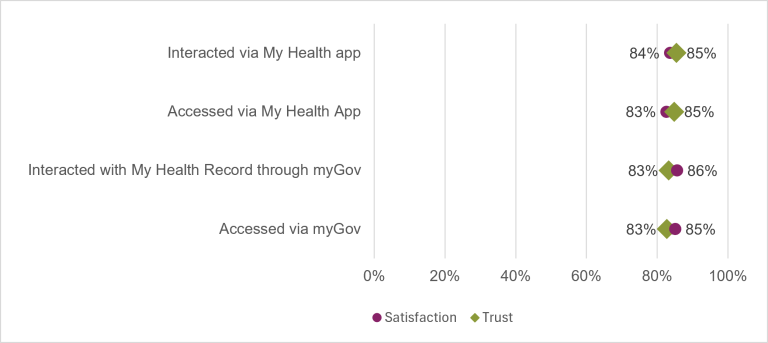
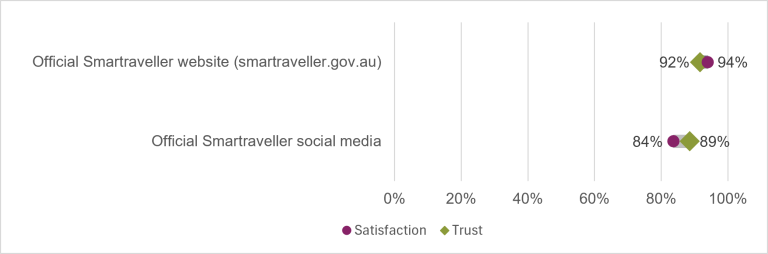
Each of the following pages relates to a particular agency (or master program) and comprises three charts:
- trust and satisfaction over time
- trust and satisfaction based on what service-related activities respondents undertook
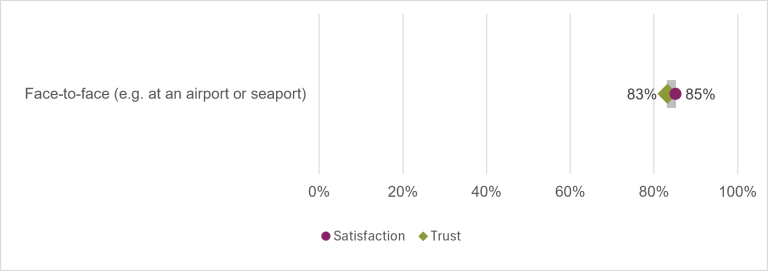
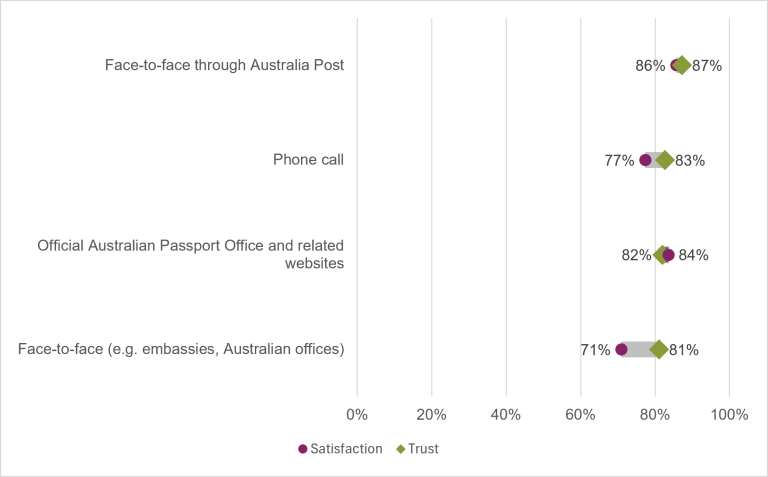
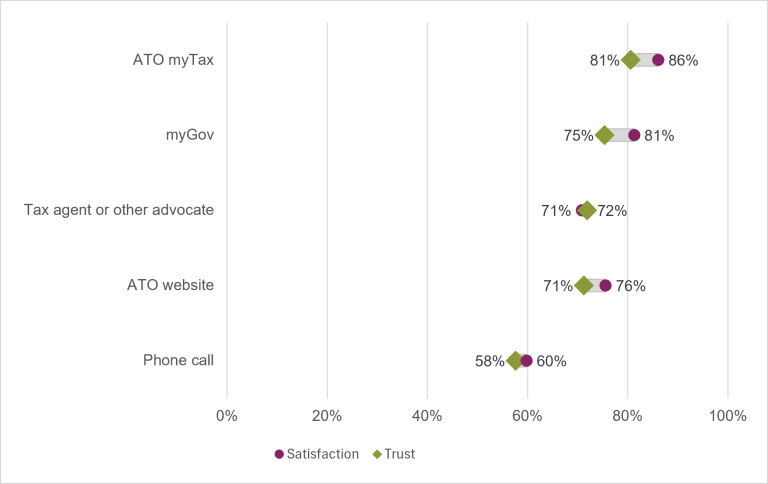
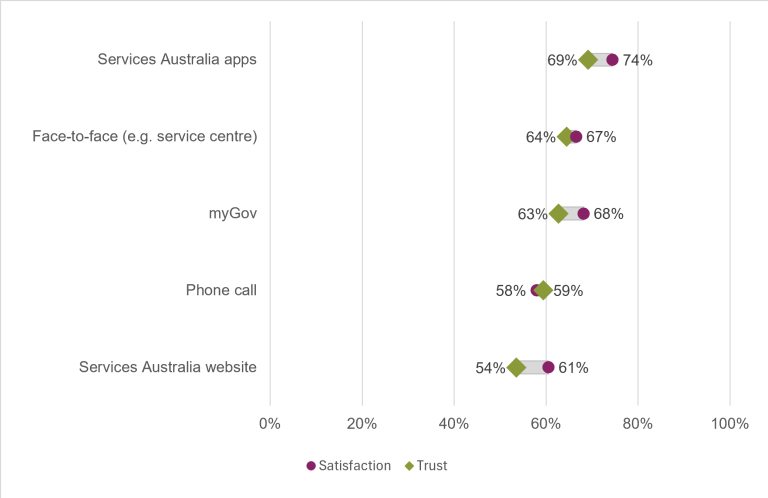
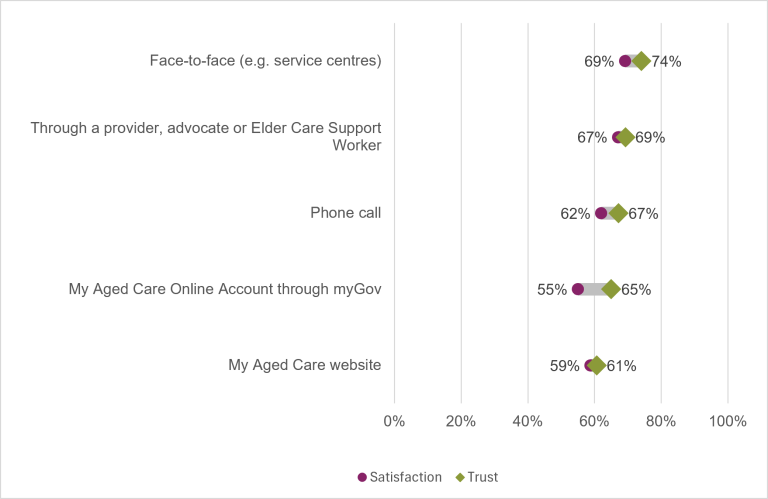
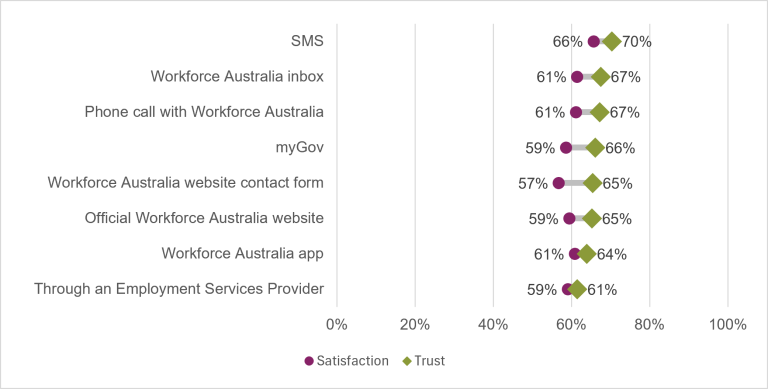
- trust and satisfaction based on what channel respondents accessed services through.
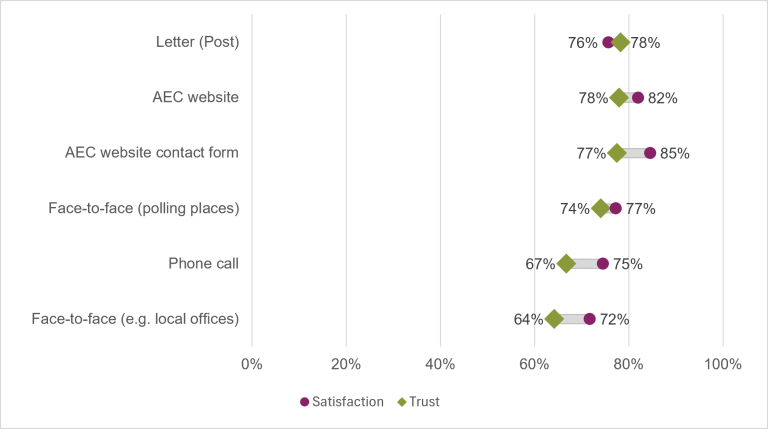
Note: Trust[1] and satisfaction[2] relates to the overall service experience.
Each chart has data based on groupings of people who undertook an activity or accessed services through the relevant activities outlined in that chart. These people may have undertaken other activities or accessed services through other channels as well. These other experiences would also influence their overall sentiment.
Charts do not necessarily contain all possible service activities and channels. Activities and channels with sample sizes under n=50 are excluded. Some labels have been shortened for display.
Sample sizes vary for each service and are available in the technical appendix, as are more details about the above caveats.
Australian Border Force – Department of Home Affairs
Figure 5: Australian Border Force – Department of Home Affairs - Change over time
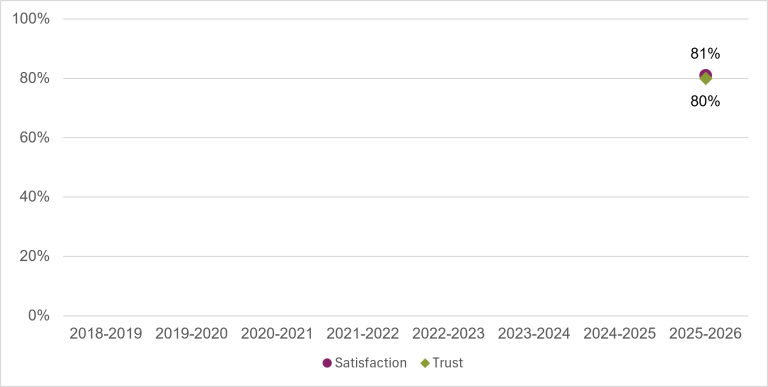
Figure 6: Australian Border Force – Department of Home Affairs - Service activities
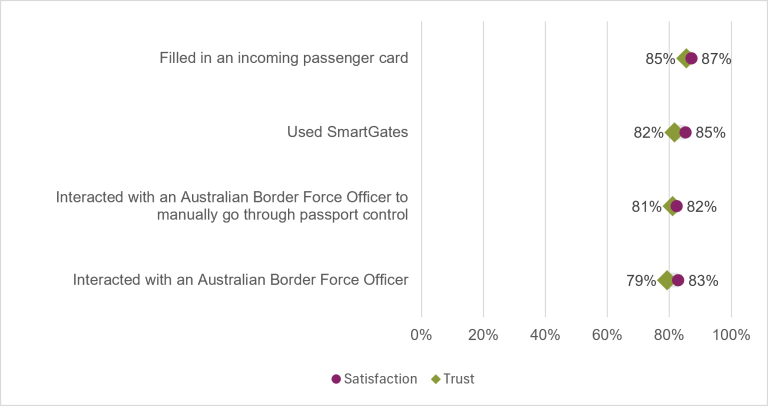
Figure 7: Australian Border Force – Department of Home Affairs - Channels
Australian Competition and Consumer Commission
Figure 8: Australian Competition and Consumer Commission – Change over time
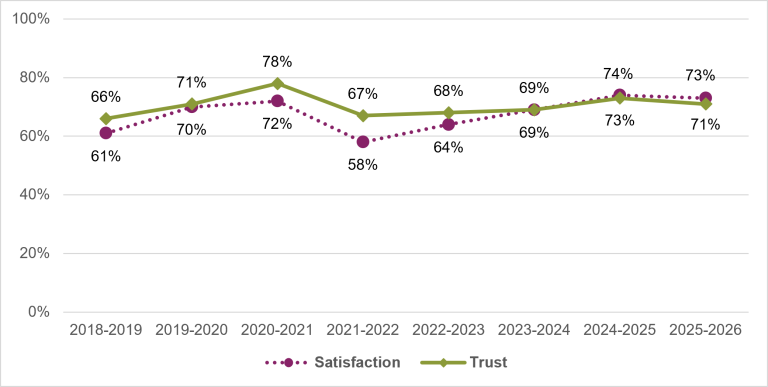
Figure 9: Australian Competition and Consumer Commission – Service activities
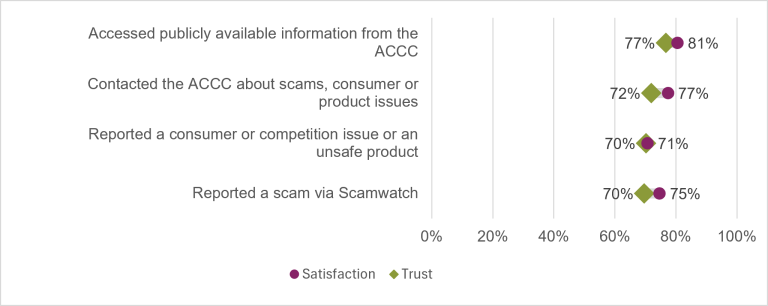
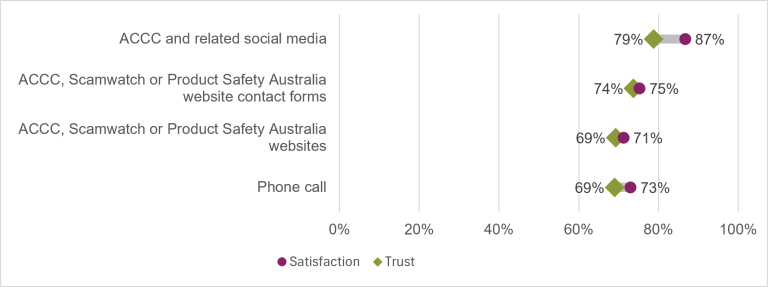
Figure 10: Australian Competition and Consumer Commission – Channels
Australian Electoral Commission
Figure 11: Australian Electoral Commission – Change over time
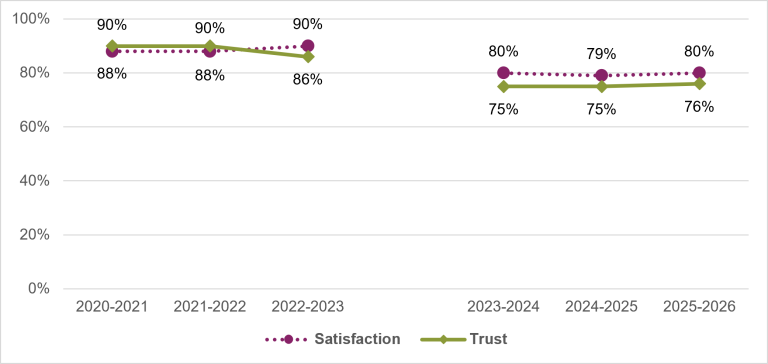
Note: a method change affected findings for the Australian Electoral Commission in the 2023–24 financial year. The change led to over 20 times as many people answering questions about the service. This resulted in reported trust and satisfaction for the agency becoming more neutral. As such, the 2023–24 to current data are not directly comparable to 2020–21 to 2022–23.
Figure 12: Australian Electoral Commission – Service activities
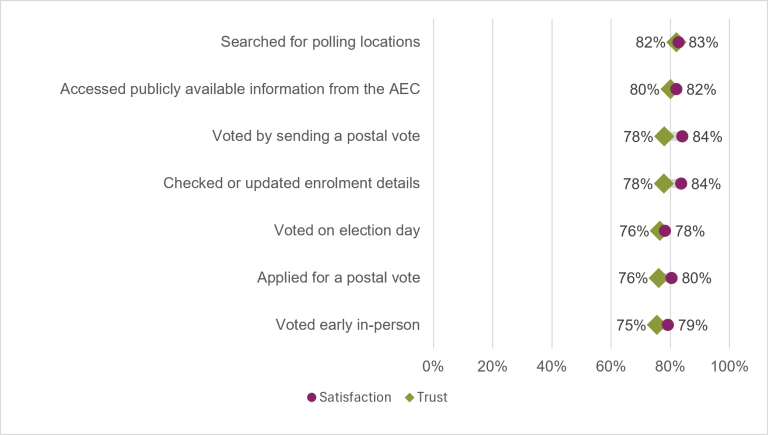
Figure 13: Australian Electoral Commission – Channels
Australian Passport Office – Department of Foreign Affairs and Trade
Figure 14: Australian Passport Office – Department of Foreign Affairs and Trade – Change over time
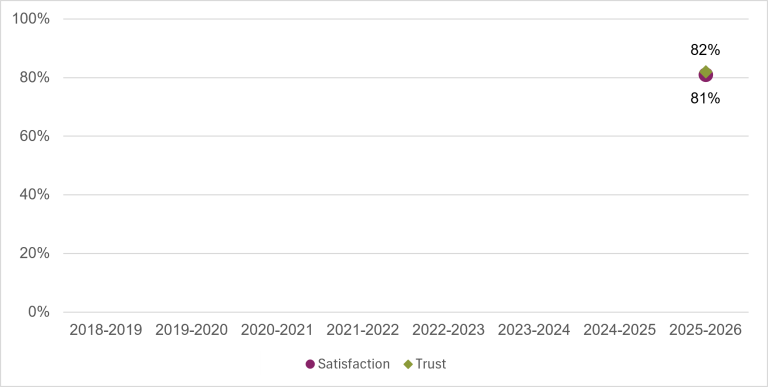
Figure 15: Australian Passport Office – Department of Foreign Affairs and Trade – Service activities
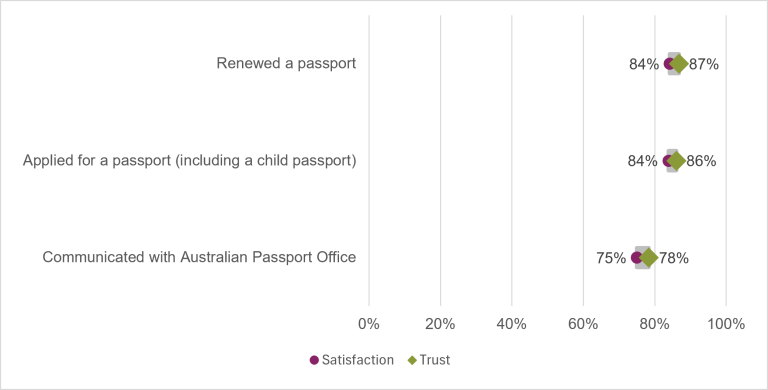
Figure 16: Australian Passport Office – Department of Foreign Affairs and Trade – Channels
Australian Taxation Office
Figure 17: Australian Taxation Office – Change over time
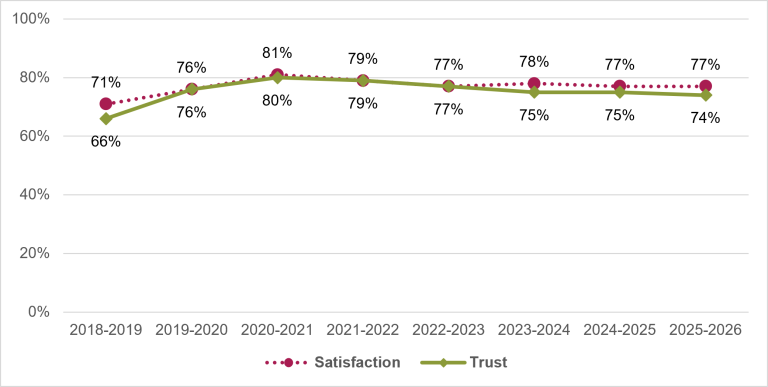
Figure 18: Australian Taxation Office – Service activities
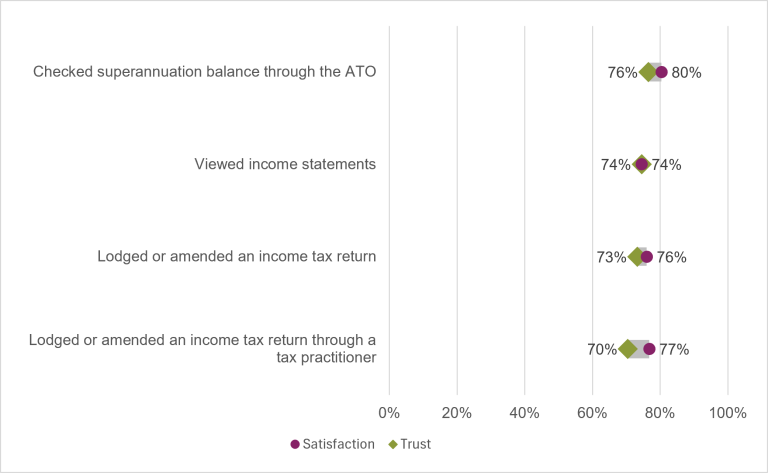
Figure 19: Australian Taxation Office – Channels
Australian Visas and Citizenship – Department of Home Affairs
Figure 20: Australian Visas and Citizenship – Department of Home Affairs – Change over time
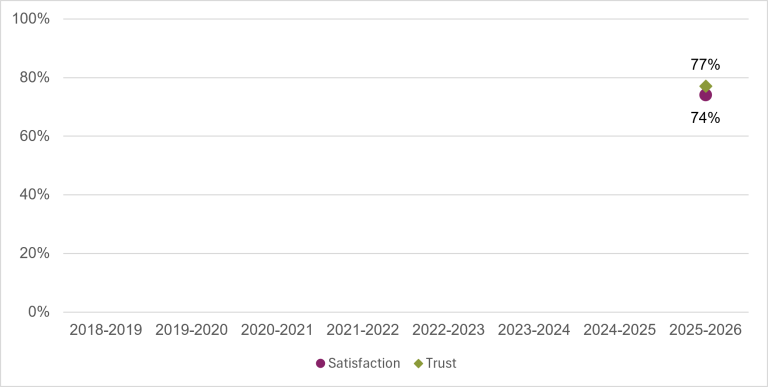
Figure 21: Australian Visas and Citizenship – Department of Home Affairs – Service activities
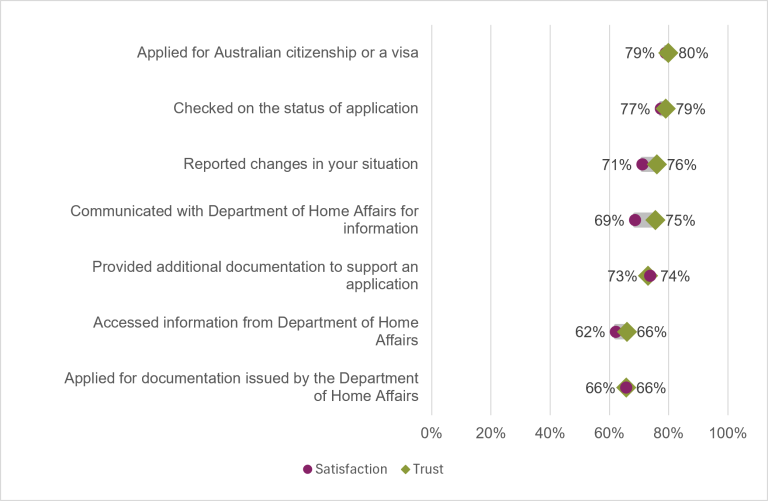
Figure 22: Australian Visas and Citizenship – Department of Home Affairs – Channels
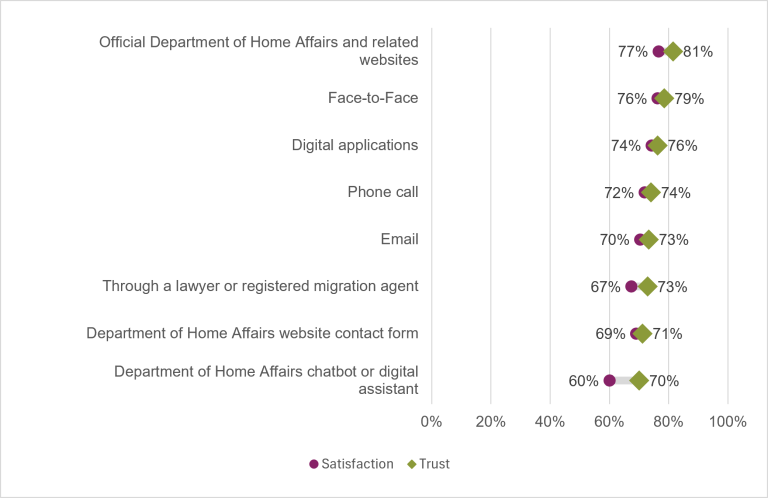
Biosecurity – Department of Agriculture, Fisheries and Forestry
Figure 23: Biosecurity – Department of Agriculture, Fisheries and Forestry – Change over time
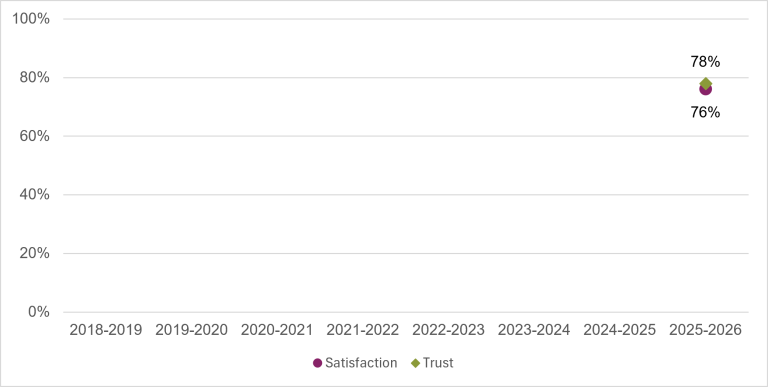
Figure 24: Biosecurity – Department of Agriculture, Fisheries and Forestry – Service activities
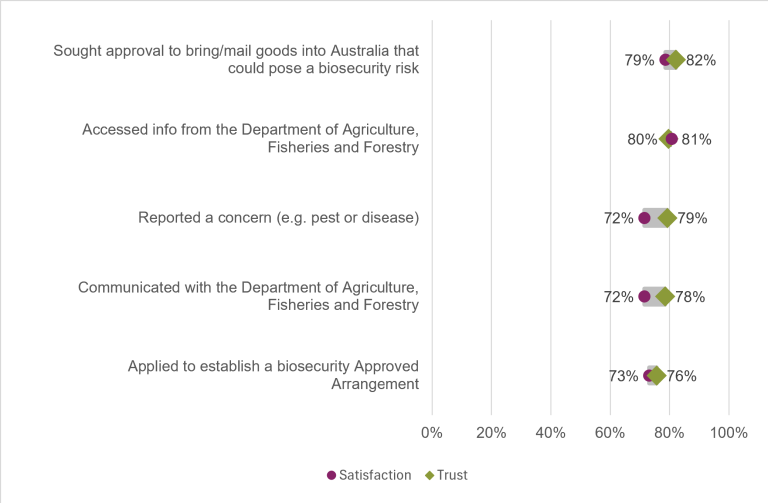
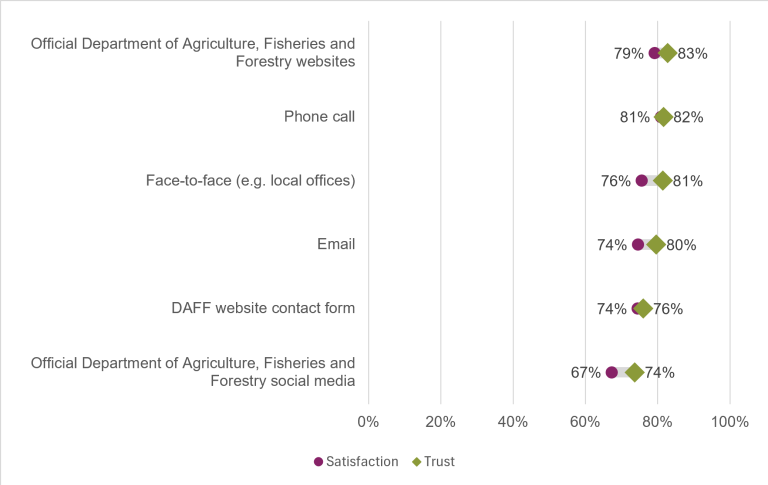
Figure 25: Biosecurity – Department of Agriculture, Fisheries and Forestry – Channels
Centrelink – Services Australia
Figure 26: Centrelink – Services Australia – Change over time
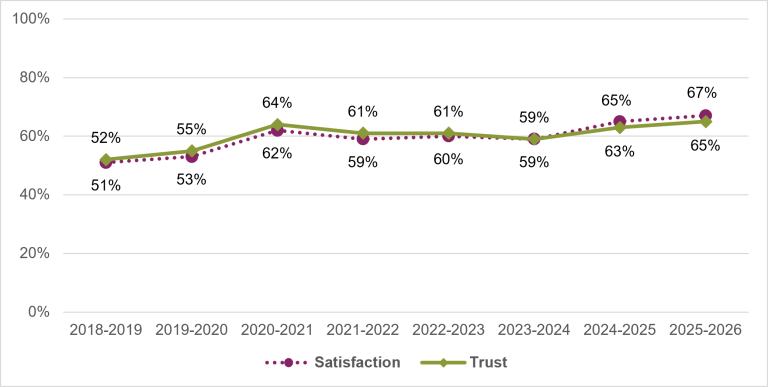
Figure 27: Centrelink – Services Australia – Service activities
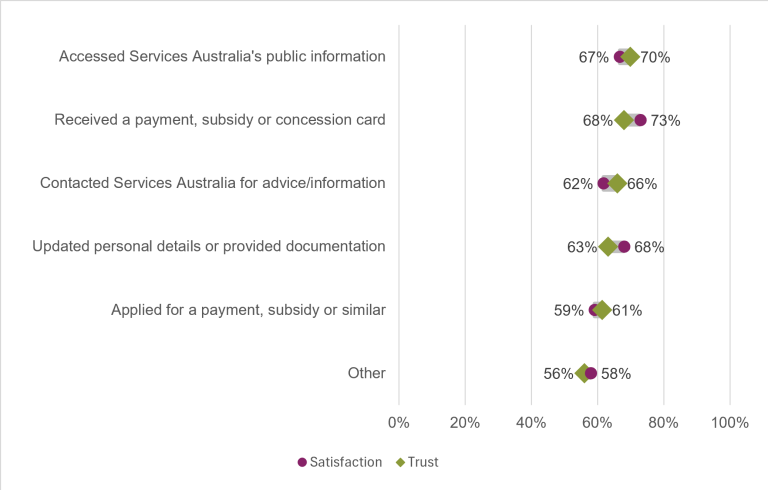
Figure 28: Centrelink – Services Australia – Channels
Child Support – Services Australia
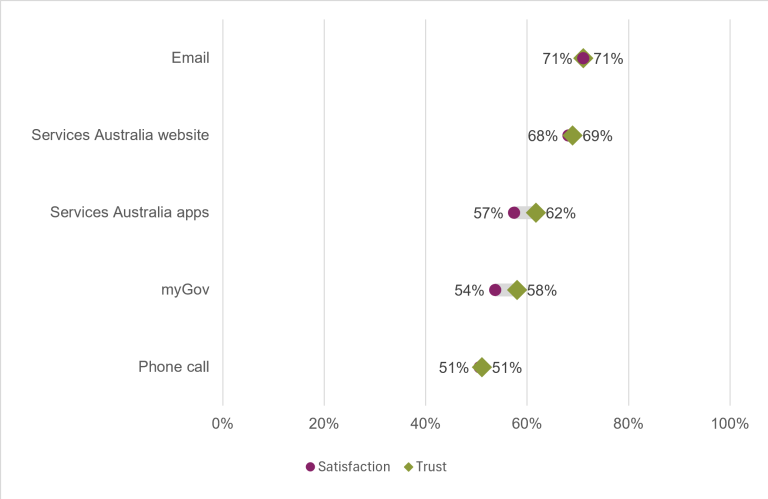
Figure 29: Child Support – Services Australia – Change over time
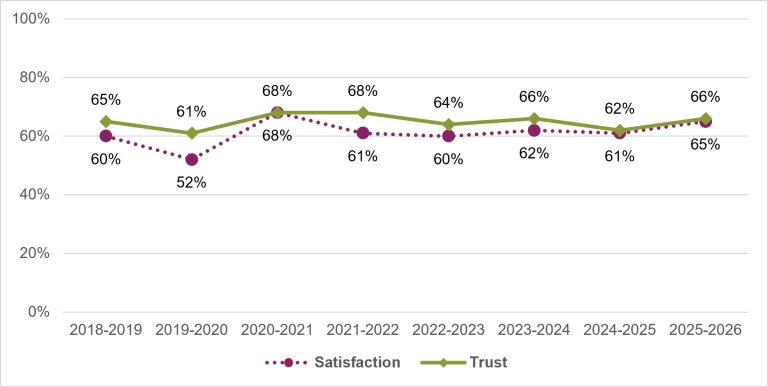
Figure 30: Child Support – Services Australia – Service activities
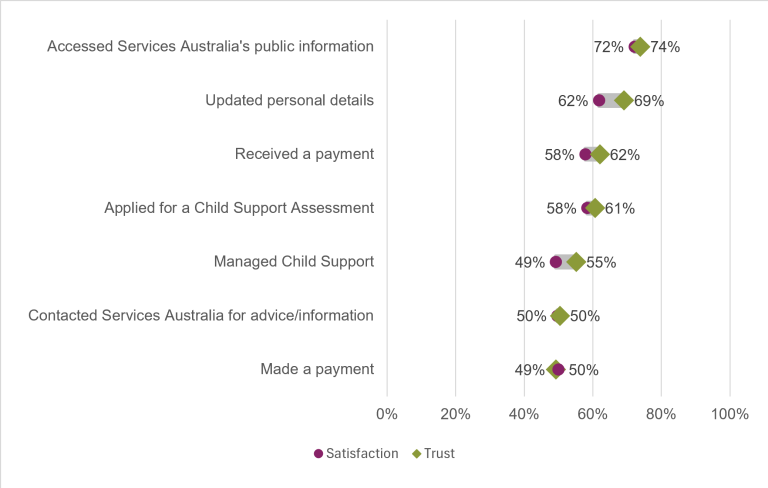
Figure 31: Child Support – Services Australia – Channels
Department of Veterans’ Affairs
Figure 32: Department of Veterans’ Affairs – Change over time
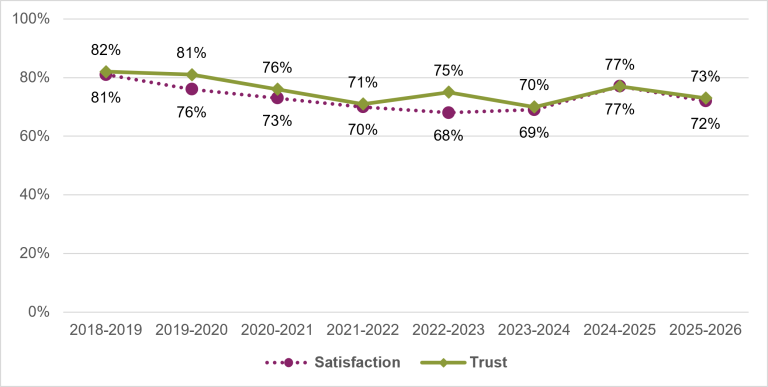
Figure 33: Department of Veterans’ Affairs – Service activities
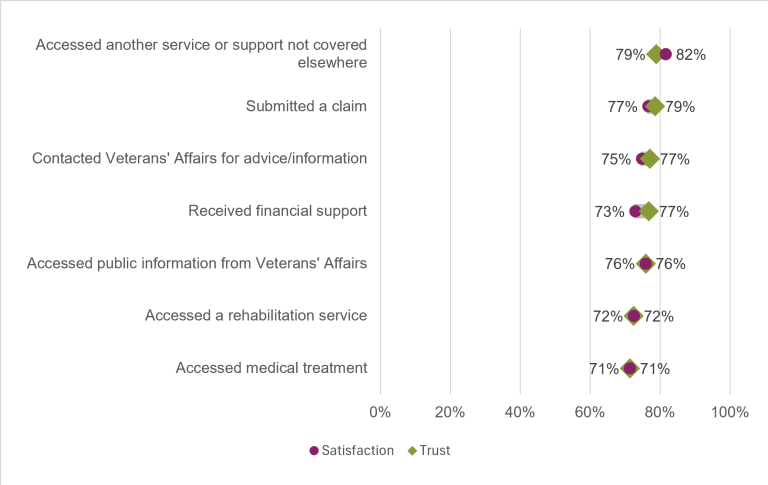
Figure 34: Department of Veterans’ Affairs – Channels
Fair Work Ombudsman
Figure 35: Fair Work Ombudsman – Change over time
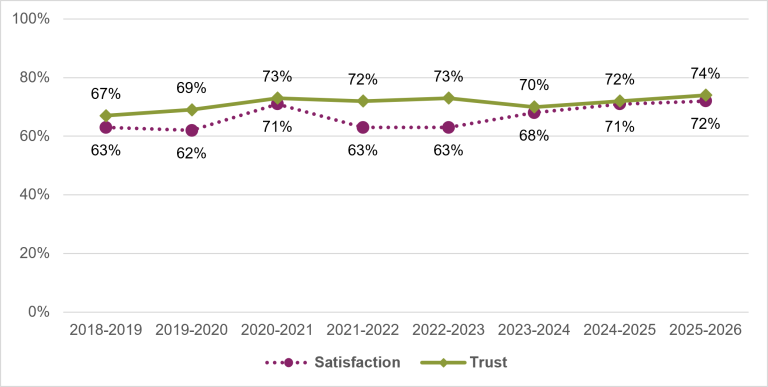
Figure 36: Fair Work Ombudsman – Service activities
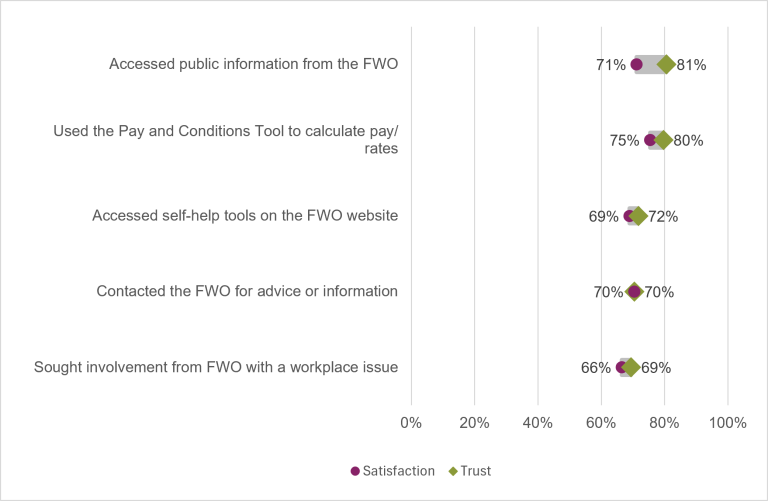
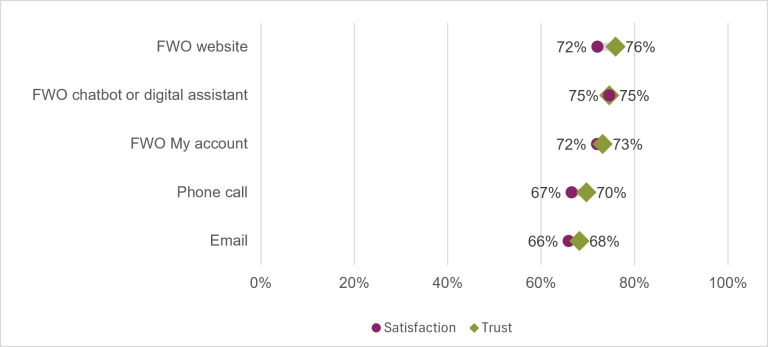
Figure 37: Fair Work Ombudsman – Channels
Medicare – Services Australia
Figure 38: Medicare – Services Australia – Change over time
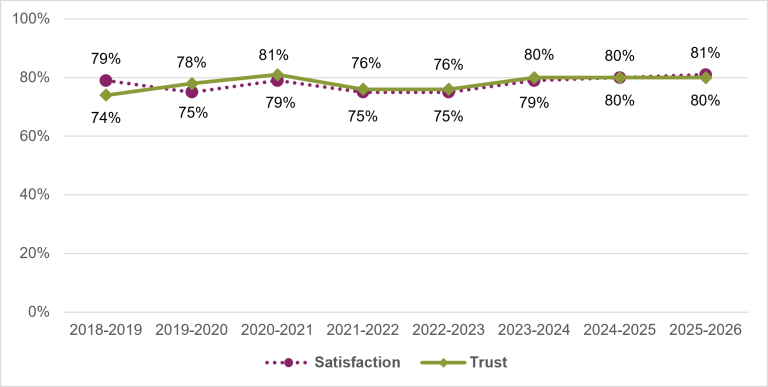
Figure 39: Medicare – Services Australia – Service activities
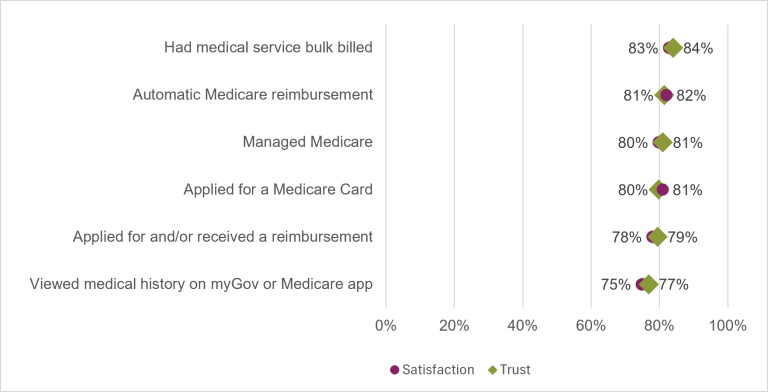
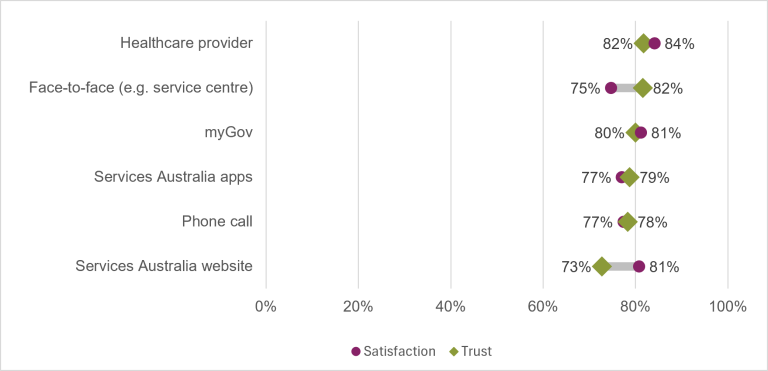
Figure 40: Medicare – Services Australia – Channels
My Aged Care – Department of Health, Disability and Ageing
Figure 41: My Aged Care – Department of Health, Disability and Ageing – Change over time
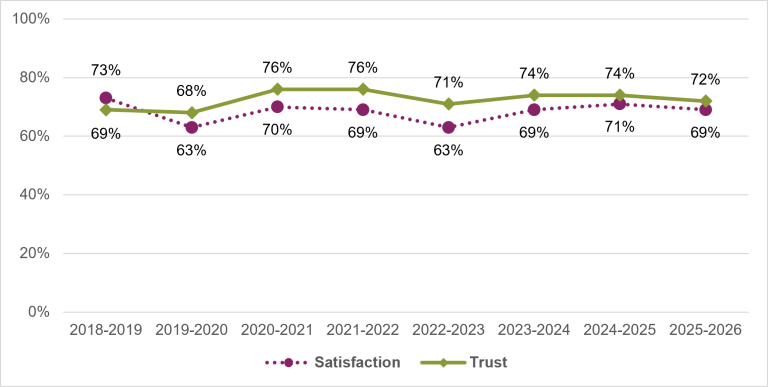
Figure 42: My Aged Care – Department of Health, Disability and Ageing – Service activities
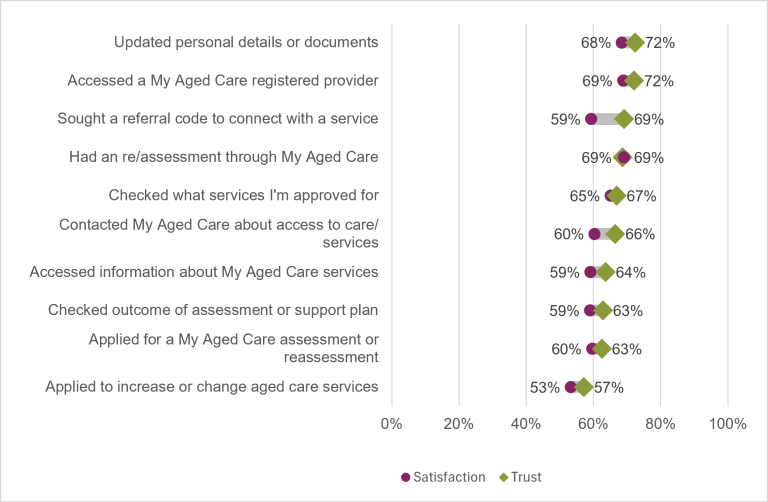
Figure 43: My Aged Care – Department of Health, Disability and Ageing – Channels
My Health Record – Australian Digital Health Agency
Figure 44: My Health Record – Australian Digital Health Agency – Change over time
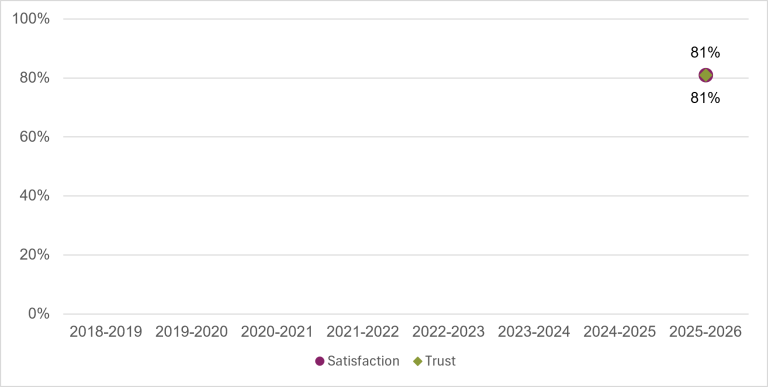
Figure 45: My Health Record – Australian Digital Health Agency – Service activities
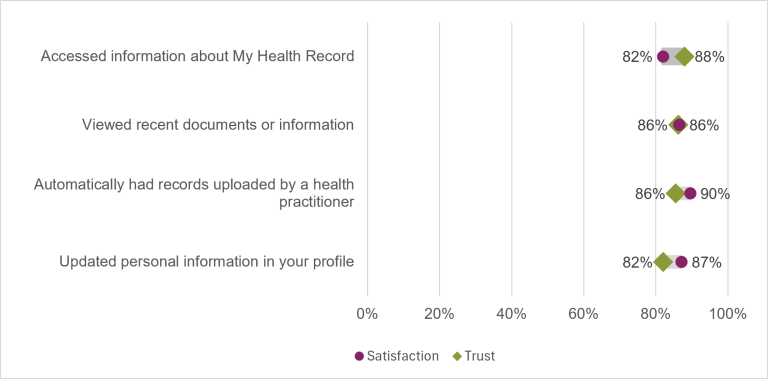
Figure 46: My Health Record – Australian Digital Health Agency – Channels
National Disability Insurance Scheme
Figure 47: National Disability Insurance Scheme – Change over time
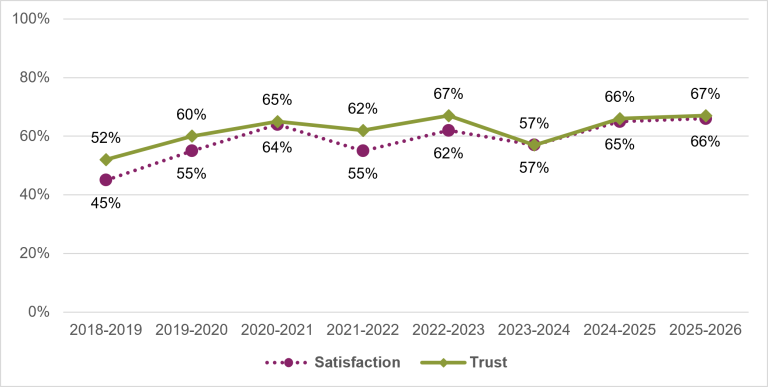
Figure 48: National Disability Insurance Scheme – Service activities
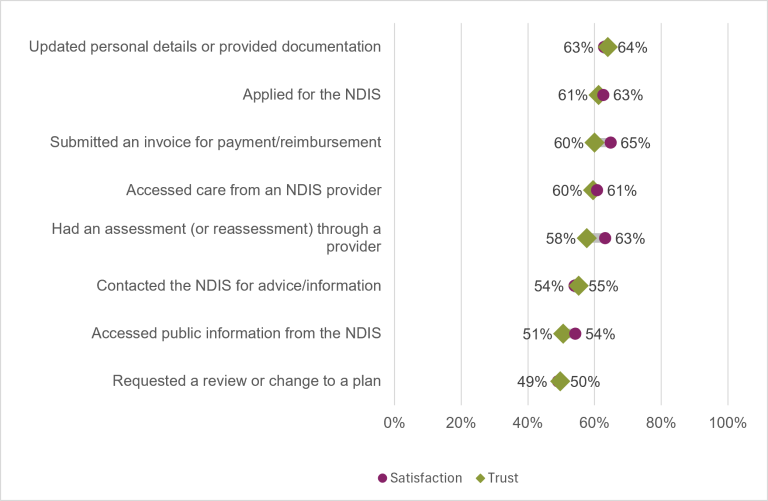
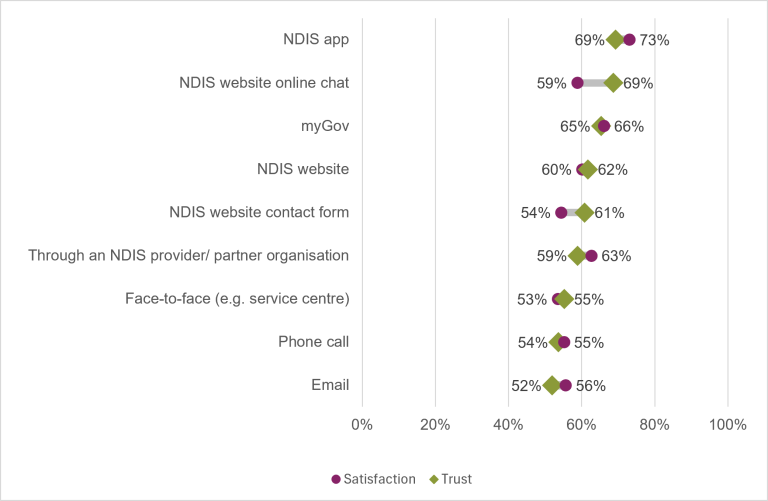
Figure 49: National Disability Insurance Scheme – Channels
Pharmaceuticals Benefits Scheme
Figure 50: Pharmaceuticals Benefits Scheme – Change over time
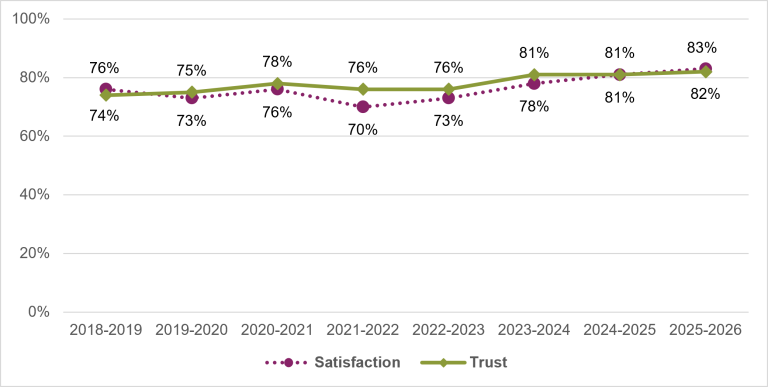
Figure 51: Pharmaceuticals Benefits Scheme – Service activities
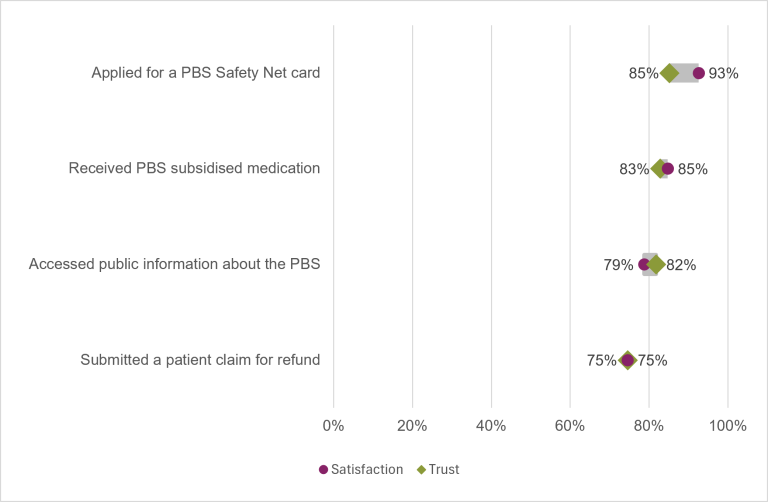
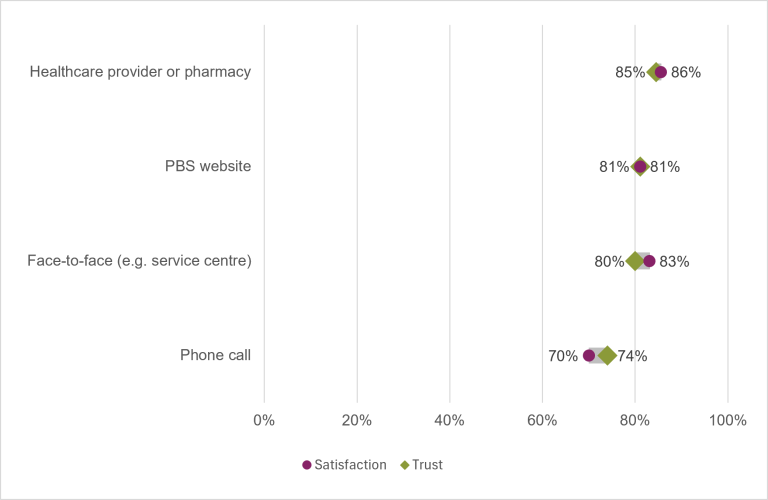
Figure 52: Pharmaceuticals Benefits Scheme – Channels
Smartraveller – Department of Foreign Affairs and Trade
Figure 53: Smartraveller – Department of Foreign Affairs and Trade – Change over time
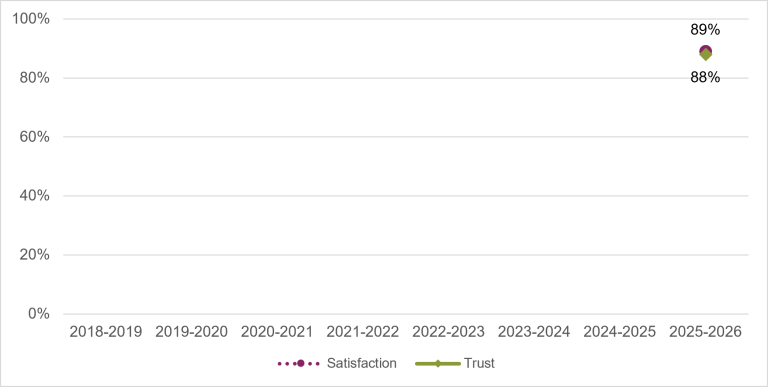
Figure 54: Smartraveller – Department of Foreign Affairs and Trade – Service activities
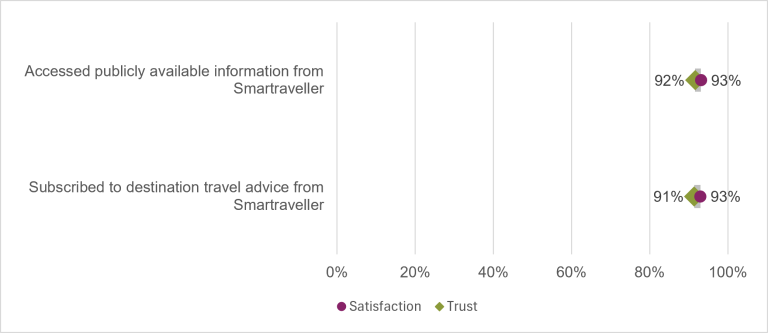
Figure 55: Smartraveller – Department of Foreign Affairs and Trade – Channels
Unique Student Identifier
Figure 56: Unique Student Identifier – Change over time
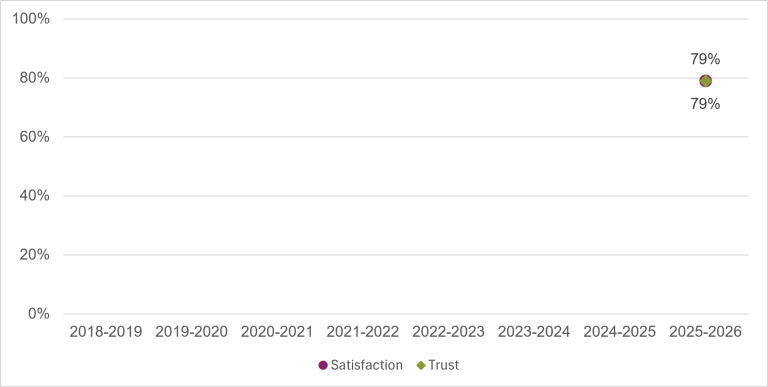
Figure 57: Unique Student Identifier – Service activities
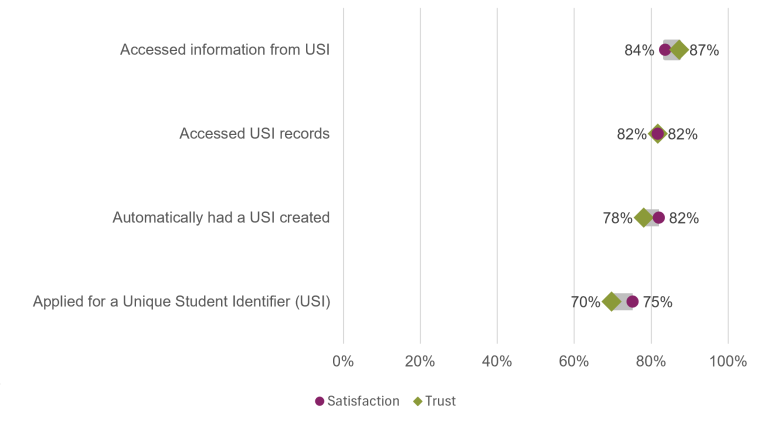
Figure 58: Unique Student Identifier – Channels
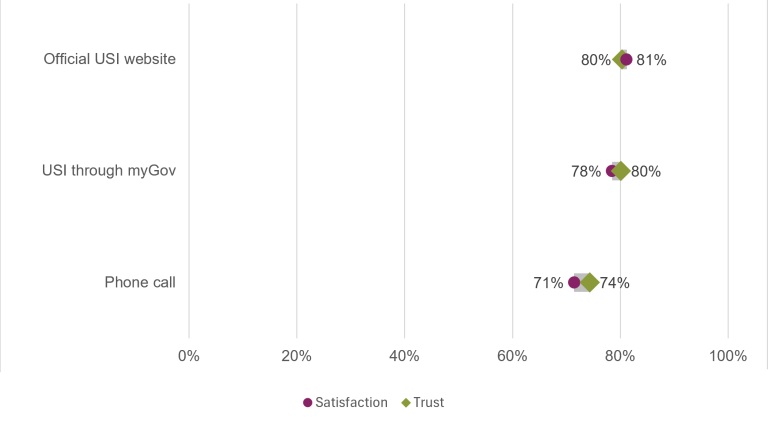
Workforce Australia – Department of Employment and Workplace Relations
Figure 59: Workforce Australia – Department of Employment and Workplace Relations – Change over time
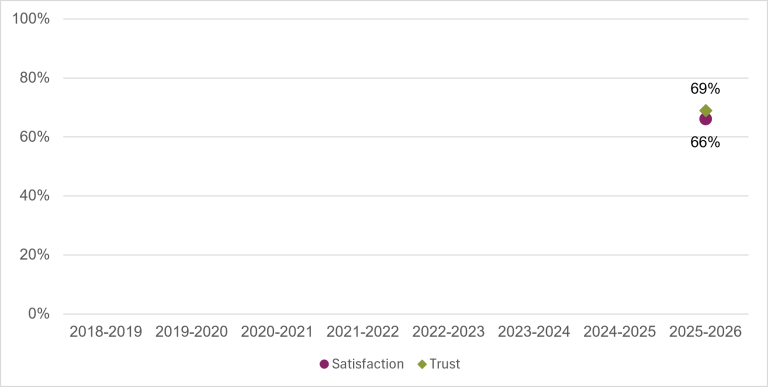
Figure 60: Workforce Australia – Department of Employment and Workplace Relations – Service activities
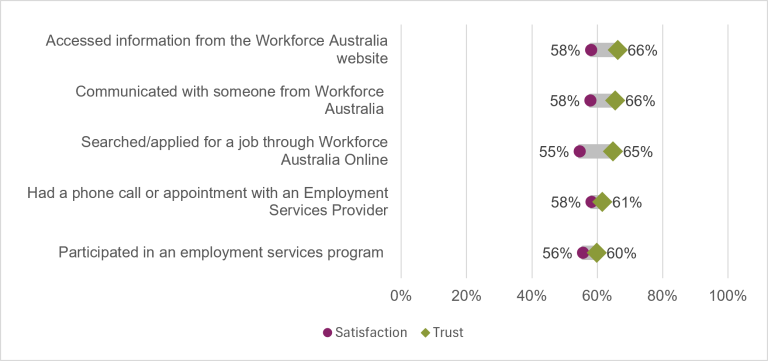
Figure 61: Workforce Australia – Department of Employment and Workplace Relations – Channels
Footnotes
[1] Q7: Overall trust is the proportion of people who answered “Strongly agree” or “Agree” when asked “How much do you agree with the following statement – ‘I can trust Australian public services’”.↩ Return to text
[2] Q26: Trust in specific services is the proportion of people who answered “Strongly agree” or “Agree” when asked “How much do you agree with the following statement – ‘The service is trustworthy’” about a specific service. The proportion is adjusted pro rata for the amount of services each individual was asked about.↩ Return to text