



Headline results
In 2025–26…


89% of people who reported trusting public services were also satisfied with them, while 28% of people who distrusted services were still satisfied with services.
How do we compare?
OECD Survey on Drivers of Trust in Public Institutions
In June 2026, the OECD launched the OECD Survey on Drivers of Trust in Public Institutions 2026 Results. Key findings include:
- Australians’ trust in the federal government was 51% in 2025, exceeding the OECD average of 40%
- perceptions of day-to-day dealings with public institutions in Australia are more positive than the OECD average, with Australia scoring above the OECD average on all of 13 indicators
- people in Australia rate decision making on complex policy issues above the OECD average on 14 out of 15 indicators, pointing to a more favourable public assessment of how well the governmental system handles complex, long-term issues, incorporates citizen input, weighs competing interests, and acts in the public interest.
New Zealand’s Kiwis Count Survey
- The Kiwis Count survey measures the trust and confidence of New Zealanders in the Public Service, based on their most recent service experience and perception of the Public Service overall.
- Latest results as of June 2026 show that 60% of New Zealanders trust the public service brand and 80% report trust in public services based on their most recent experience.
Trust and satisfaction have remained high
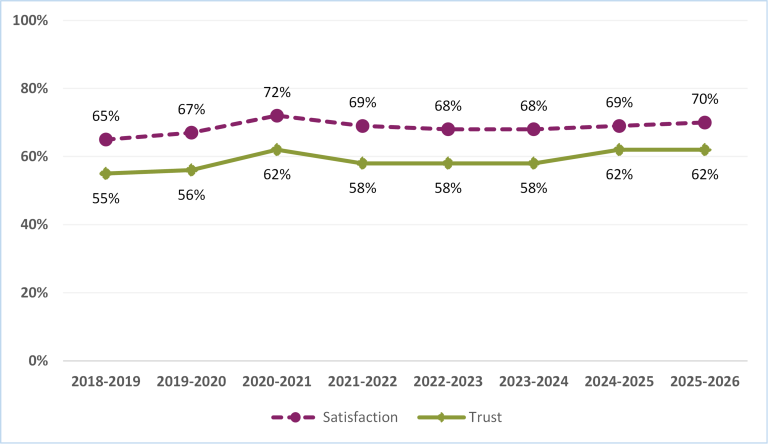
Trust[1] in Australian public services was 62% in 2025–26, matching the high from last year, while satisfaction[3] with Australian public services increased slightly to 70%.
The Survey of Trust in Australian Public Services asked respondents to reflect on their experiences with services between July 2025 and June 2026. Analysis of open-ended responses from those whose trust increased suggests they attributed this change to a range of sustained improvements in service delivery.
Figure 1: Trust and satisfaction over time
A technical appendix is available alongside this report that outlines the methodology, weighting, and sample sizes.
Why have trust and satisfaction remained high?
Since October 2023, we have been asking respondents how their trust in Australian public services compared to a year prior. For those who tell us it has either increased or decreased, we ask why. Among those reporting an increase in trust, the common themes highlighted were:
- positive personal experiences (people had direct interactions with staff who were helpful, respectful, and resolved their issue)
- improved accessibility and efficiency (services were faster, easier to use online, and more transparent)
- many people accessed services for the first time and found them better than they had expected.
These themes were broadly consistent with those identified last year, when trust also increased.
“Some positive experiences with staff who were clearly trained well and were kind, caring and compassionate, and I can see some upgrades in some areas, making information processes and reporting processes much easier.”
Woman, 39, Regional NSW, July 2025
“Services feel much more reliable, with shorter wait times and simpler digital tools.”
Man, 33, Metro Victoria, April 2026
“I had never been into a passport office but since going in there I feel much more trusting of them.”
Woman, 32, Regional South Australia, September 2025
Despite there being significant global and national attention on public services for the last two years, no respondents attributed a shift in their trust to international events in the media. Respondents predominantly described their personal experiences with services as the basis for changes in sentiment.
Footnotes
[1] Q7: Overall trust is the proportion of people who answered “Strongly agree” or “Agree” when asked “How much do you agree with the following statement – ‘I can trust Australian public services’”.↩ Return to text
[3] Q22: Satisfaction is the proportion of people who answered “Completely satisfied” or “Satisfied” when asked “Thinking about your overall experience with the above services, how satisfied or dissatisfied are you?”. ↩ Return to text
[6] Q7: Distrust is the proportion of people who answered “strongly disagree” or “disagree” when asked “How much do you agree with the following statement – ‘I can trust Australian public services’”. ↩ Return to text